Overview
In the App Designer editor, the Data visualization control allows you to embed a Tableau or Power BI report in your apps.
This control is available for Private and Detail pages.
Before you start
If using Tableau report
•Make sure you have configured a Tableau report in Bizagi Studio. For more information, refer to the Tableau connection documentation.
If using Power Bi report
•Make sure you have configured Power BI reports in Bizagi Studio.
•Your App Editors and Personas (end users) do not need to sign in to Power BI or have a Power BI license. Power BI licenses are exclusively for the people creating and publishing the reports to make them available for Bizagi Apps.
Using the control
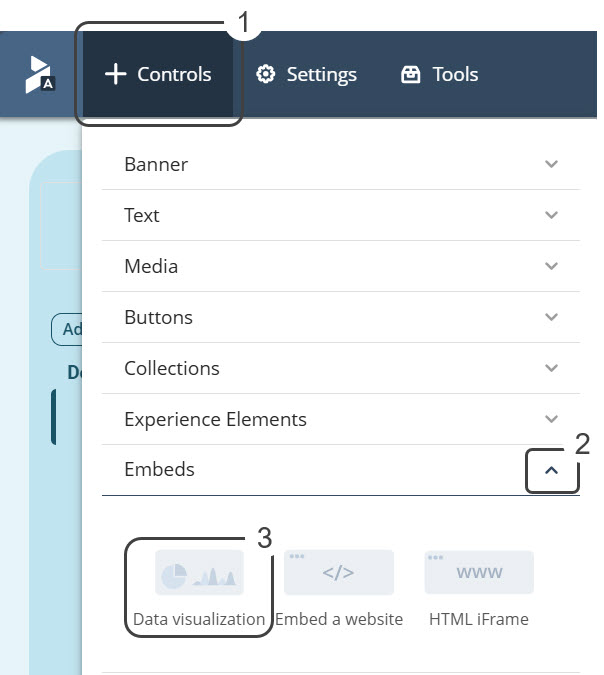
In the Controls menu, use the Data visualization control in the Embeds section.
Manage
In the Manage tab, you can define:
•Show title: whether or not the title is shown.
•Chart title: title used in the chart. From Detail pages you may use data from your Context.
•Data visualization: decide the Tableau or Power BI connection that the control will be using.
•Report ID: decide what Tableau or Power BI report the control will be using.
•Active report page: text field in case you want a specific page to be displayed when the report loads.
•Show filter pane: whether or not the filter pane is shown.
•Show navigation pane: whether or not the navigation pane is shown.
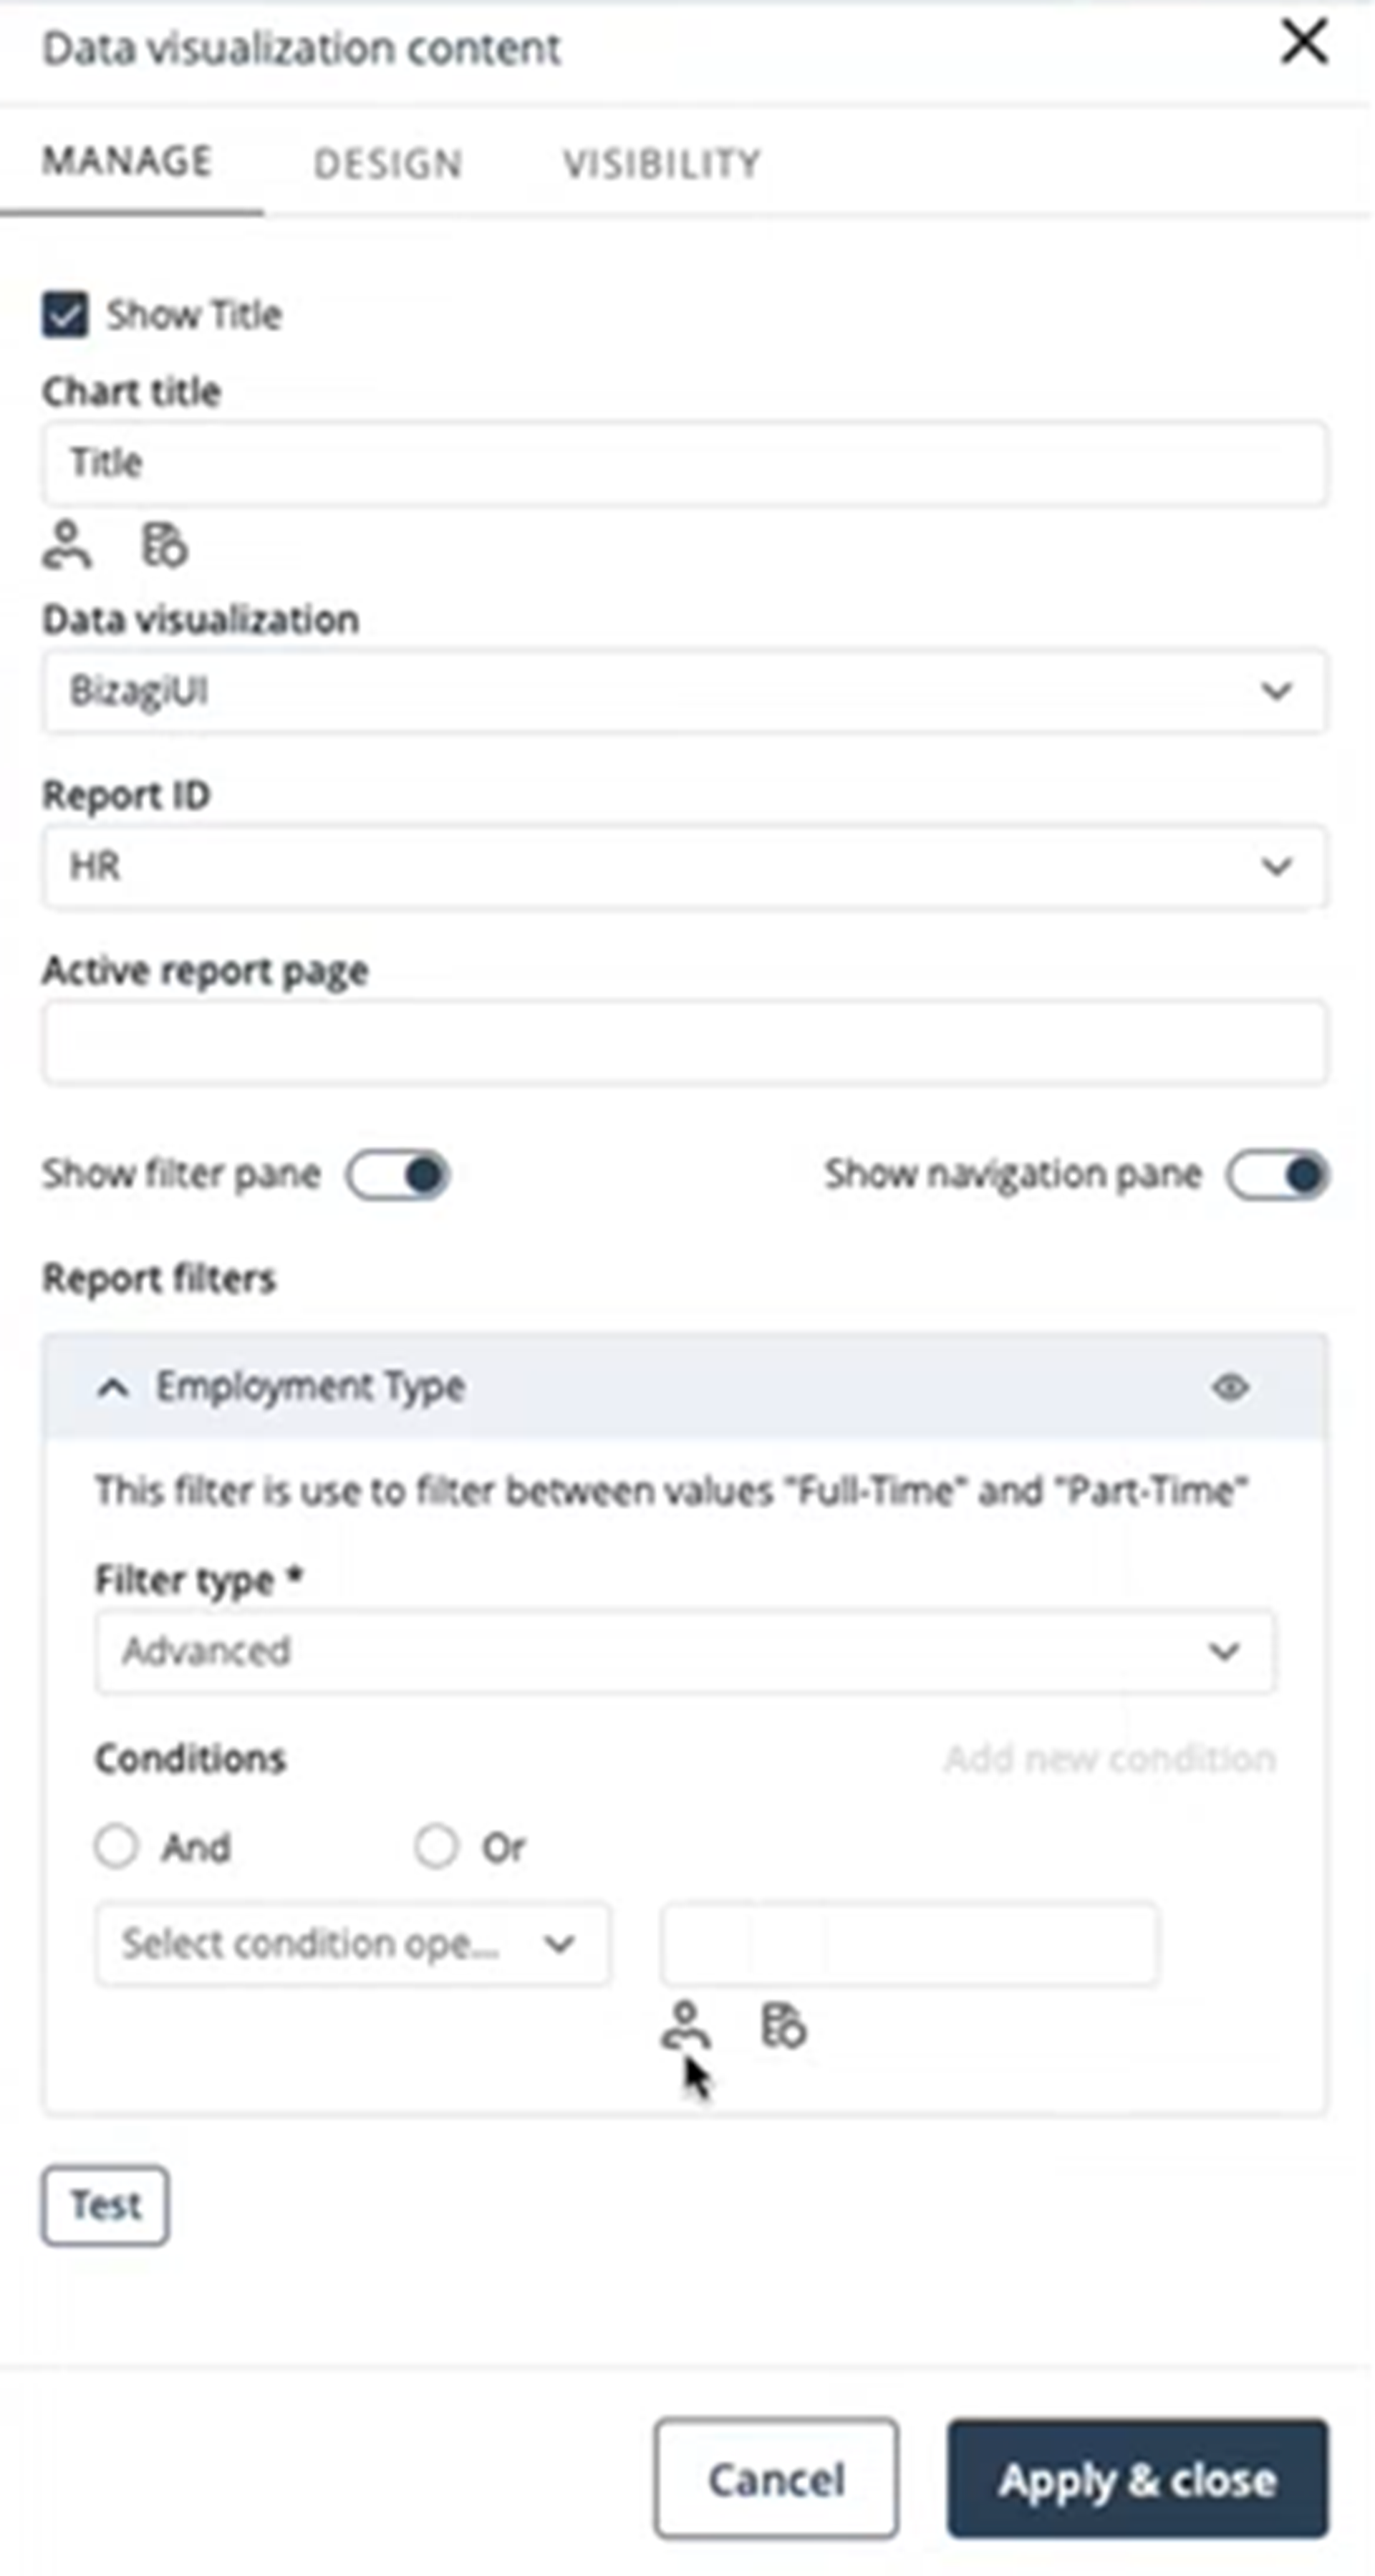
Tableau Report Filters
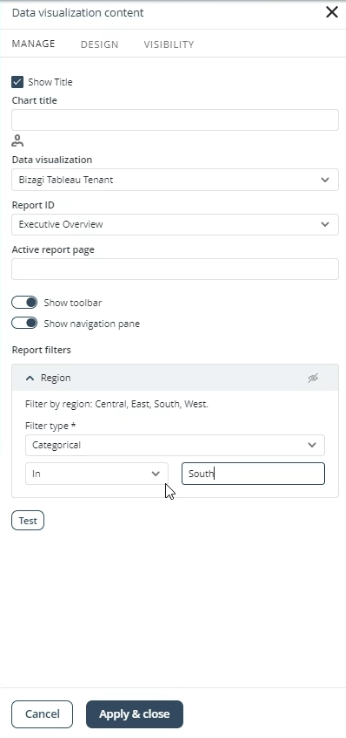
Once you have selected the options for Data visualization and the Report ID fields, the reports filters created in Bizagi Studio are displayed automatically.
The filter name and description are shown.
Using that information, app editors can identify the filter they need to use in the report.
The filter type defines if the filter is either Categorical or Range.
Categorical filter
This type of filter allows you to use the In or Not In conditions where you want to search a value you know inside the report.
Range filter
There are two subtypes of filters within this type of filter, the Date range and Numerical range.
In the Date range filter, you must set both the date minimum range value as well as the maximum range value.
In the Numerical range filter, you must set the minimum range value and the maximum range value.
After setting up the values in the report's filters you can save the changes by clicking the Test button. Is the configuration is set properly the button will change to a Successful state field.
Report filters for PBI reports
Once you have selected the Data visualization and the Report ID, the report filters created in Studio for that report are displayed automatically.
The filter name and description are shown.
Using that information, app editors can identify the filter they need to use.
The Filter type defines if the filter is Advanced, Basic or Relative date.
Advanced filter
A larger set of conditionals is displayed when using the Advanced filter. Multiple conditions can be configured, and they are logically solved using AND or OR conditionals.
Furthermore, you may filter based on entity or user fields using XPath.
Basic filter
This filter allows you to use IN and NOT IN conditions. Furthermore, you may filter based on entity or user fields using XPath.
Relative date filter
This filter has the relative date conditionals that the users may need.
As an example, assume that in a sales management report, each Persona in your Bizagi project is in charge of a certain Region across the world. In this way, you can use Report filters to match a Region column in your report. After the report filter is configured, you can use a Basic filter where the filtered column (Region) matches the current Persona's Region using the In operator. An example is shown below to illustrate the use of the Report filters.
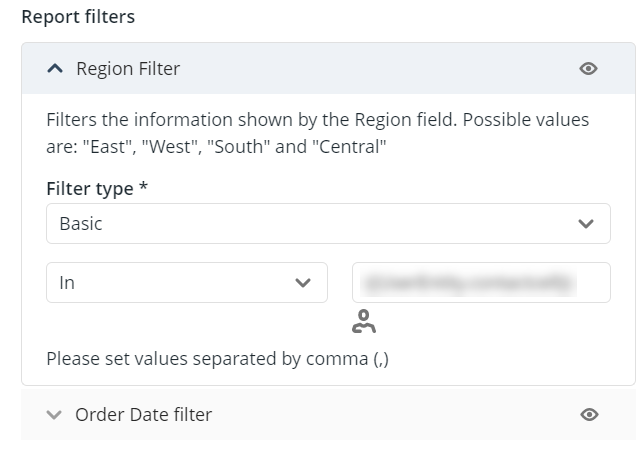
In the field next to the In operator, you should use the XPath to match the Persona's attribute corresponding to the filtered field (in our example, the Region where the Persona is located).
Design
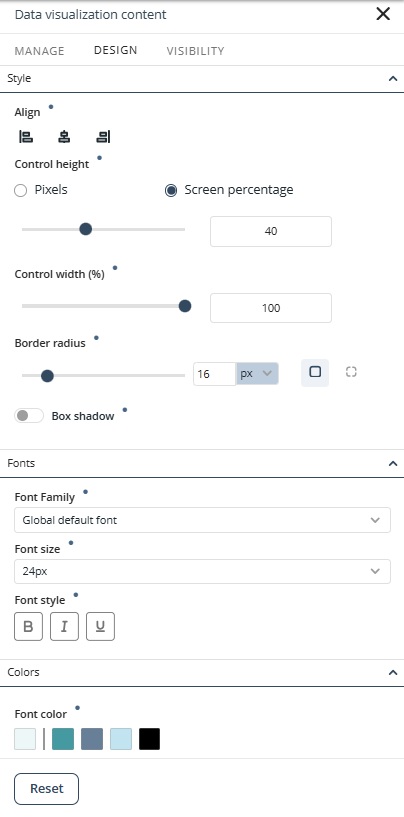
In the Design tab you can customize the Data visualization control.
Style
•Align: Set the text alignment to Left, Right, or Center.
•Control height: Define the control's height in screen percentage of pixels.
•Control width: Define the control's width in screen percentage.
•Border radius: Define the control's border radius in pixels.
•Box shadow: Enables or disable the box shadow.
Fonts
•Font family: Define the font family for the control's text.
•Font size: Define the font size.
Colors
•Font Color: Define the font color.
|
•Click the Reset button to restore the default settings. •Properties with inherited values display a blue dot next to their title. This indicator allows you to make targeted adjustments without affecting other settings. Hover over the blue dot to see the source of the inherited value, giving you greater control over your text control’s appearance. When you modify a property marked with a blue dot, its individual Reset button appears. Clicking this button restores the property to its default inherited configuration. |
Data visualization of your Tableau report
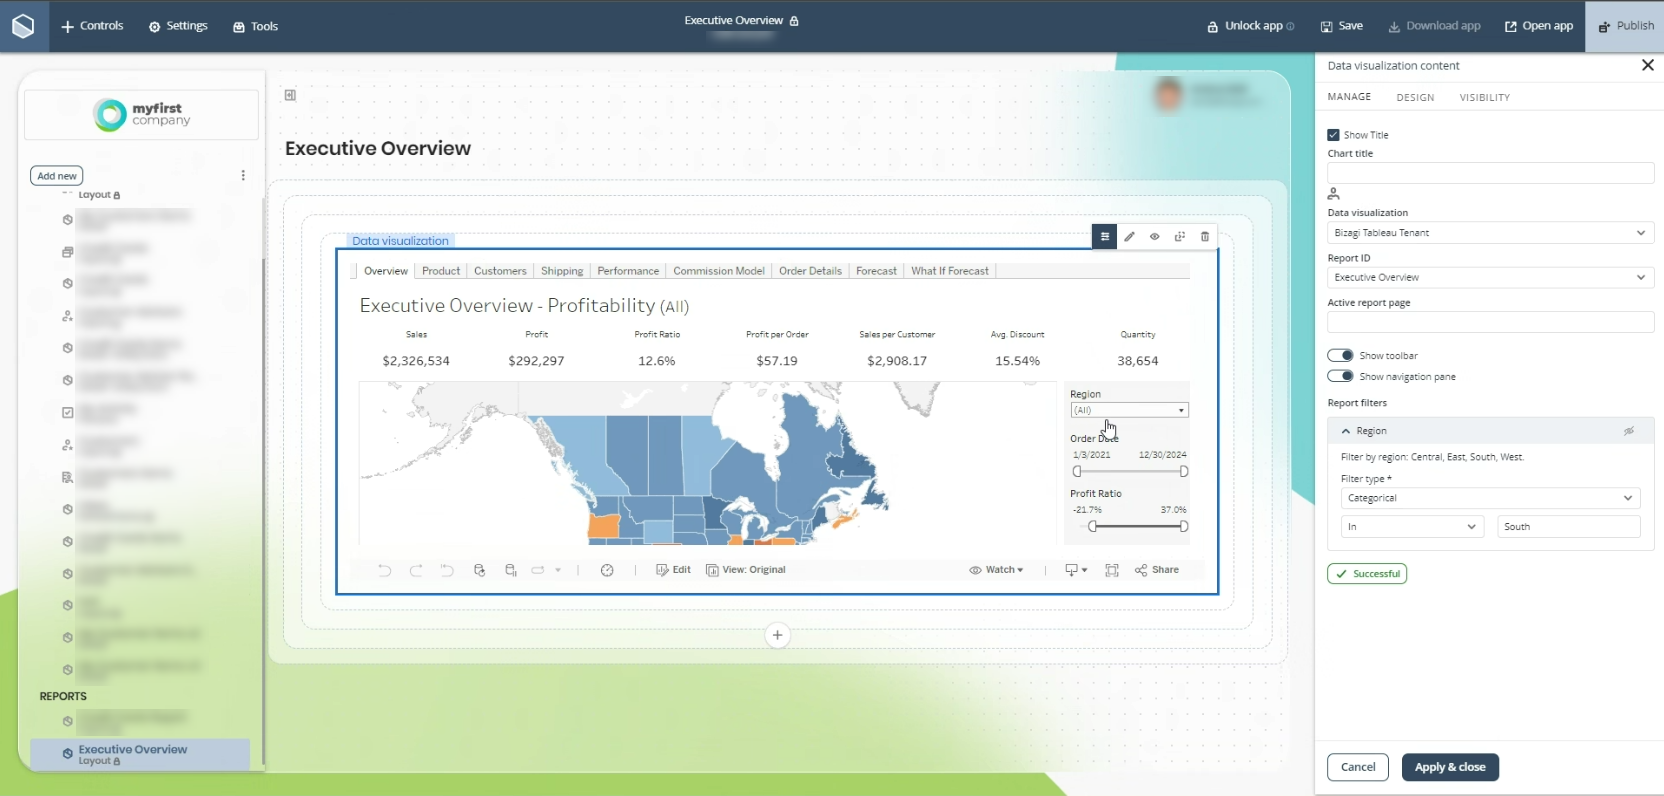
When configuring your Tableau report in the App Designer Editor, you can have a preview like the following image but be aware that the report's filters are only enabled once the app is published. Also, when creating the report connection in Bizagi Studio you must choose the Email option in the User mode field to avoid having the Sign in window by default.
After setting up your data visualization control, you can save your changes by clicking the Apply & close button. Then, to publish the app with the Publish button in the upper right corner of the window.
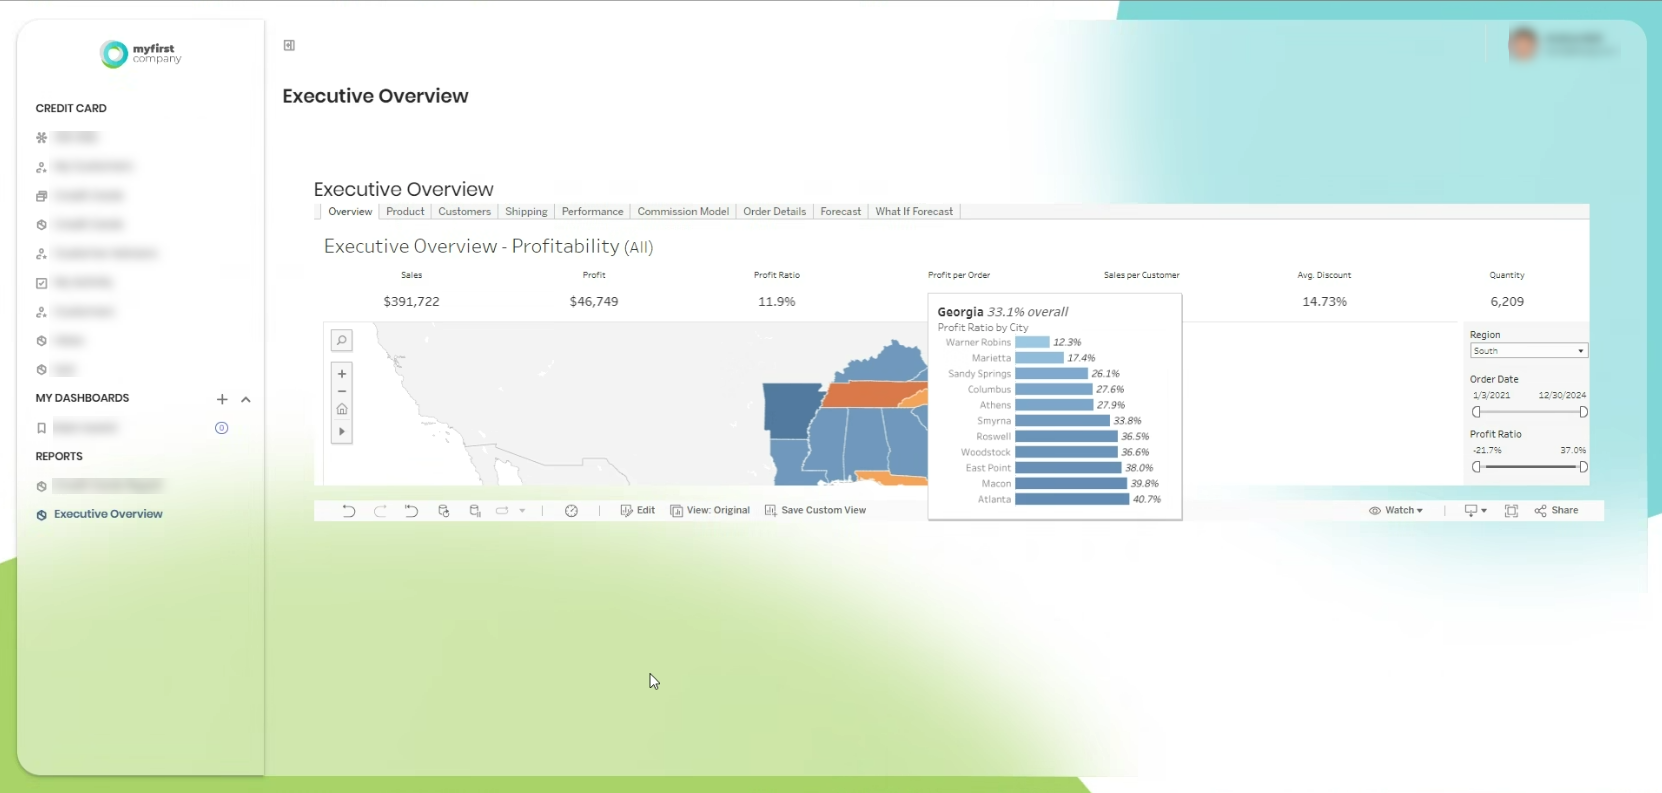
Once the app has been published, the reports filters are fully responsive and should look like the following image.
Tracking and Third Party Cookies Configuration
Given that Tableau isn't currently supported within the native app, as is the case with platforms like iOS or Android. Therefore, to access and visualize your Tableau reports through the app, the use of internet browsers is required. In this context, accepting tracking and third-party cookies is necessary. If you decide not to accept these conditions, the Tableau report cannot be viewed within the app like the following image.
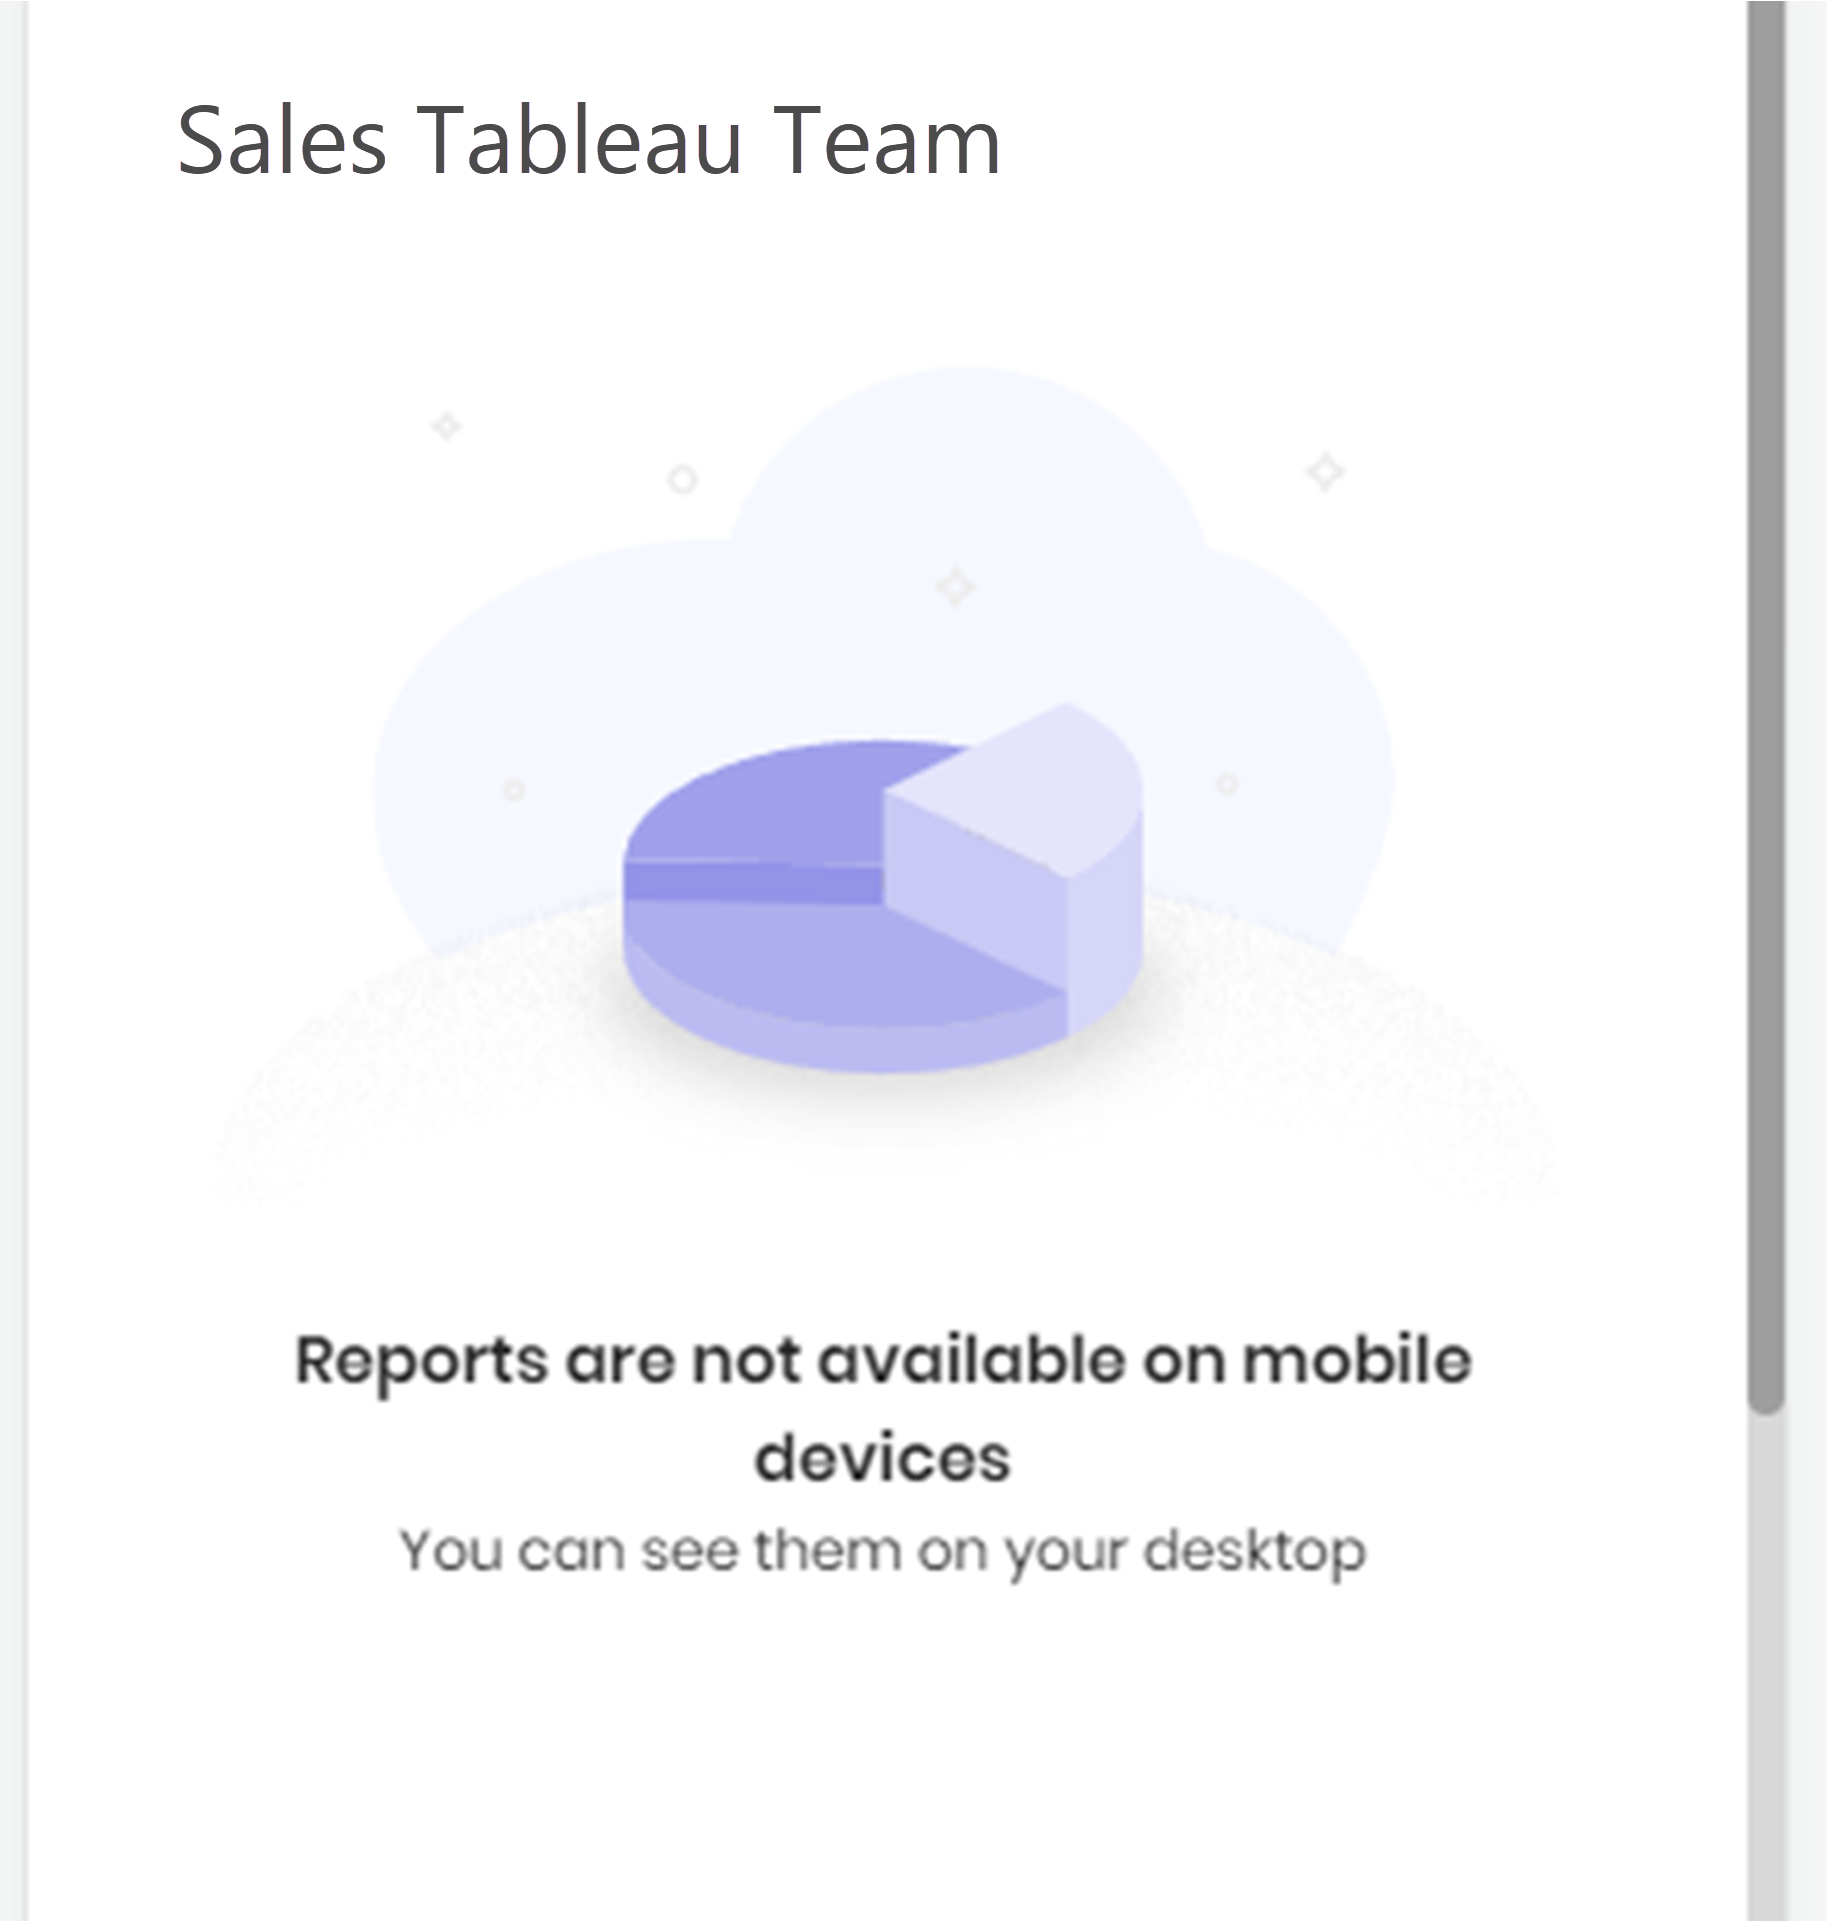
For more information on how to disable the Block all Cookies and Prevent Cross-Site tracking, visit the Apple support documentation.
Data visualization of your PBI report from a published app
Once you have configured the control with your Power BI report and published your app, your control should look like the following image.
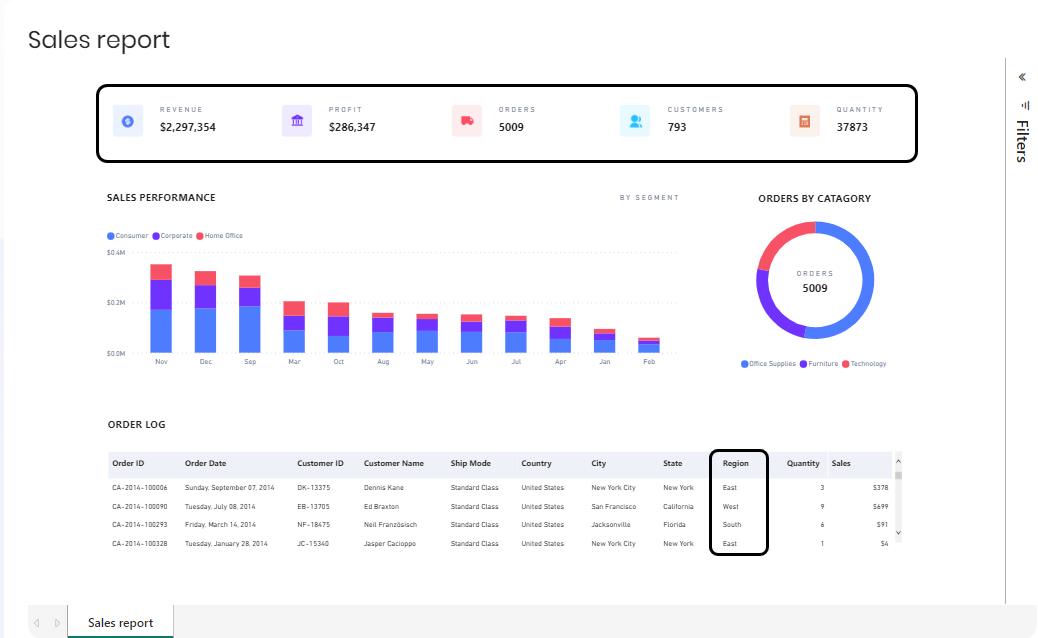
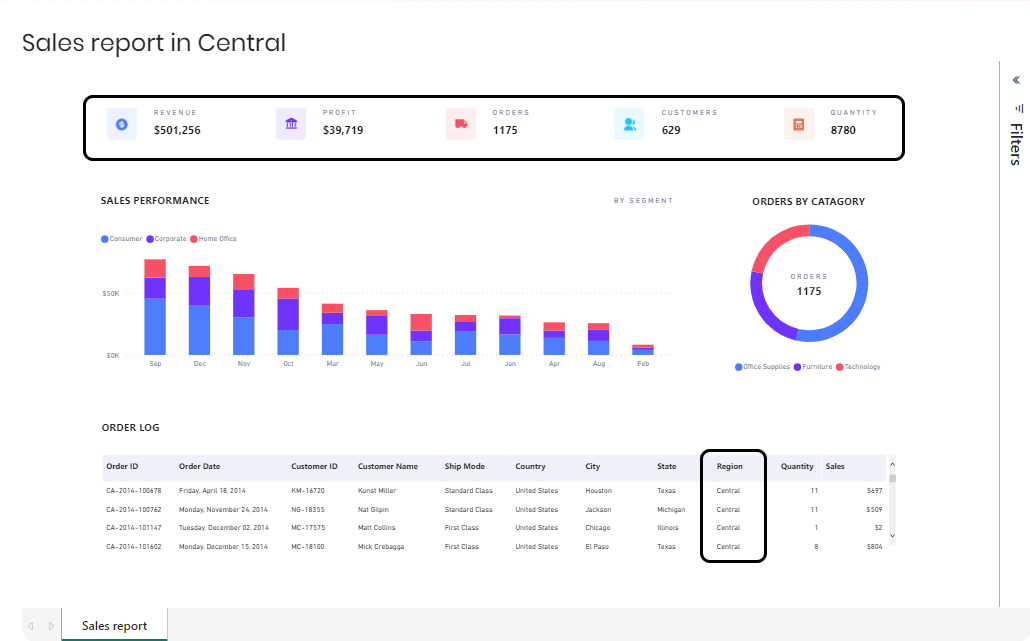
Some values are displayed when the report is shown without filters. The following image represents how a filter would modify the data displayed in the report.
For instance, in the Order log table, the Region column displays different values when no filters are being applied. When a filter is used, the only value shown is Central; the values at the top of the report are bigger in the report without filters than the filtered report.
Mobile devices considerations
When accessing the platform from a mobile device, please keep the following in mind:
•Access methods: you can access the platform either through a mobile browser or Bizagi's mobile application. The experience may vary depending on the option chosen.
•Landscape view: If accessed via a browser, landscape orientation is supported, although it is not recommended. However, it can improve the display of reports and charts in your app. This view is not available in Bizagi's mobile application.
•Zoom feature: Zooming is not supported in either the browser or Bizagi's mobile application. However, if you access via a browser and switch to Desktop view, zooming becomes possible for a better view of reports and charts. Bare in mind that this behavior may vary depending on the browser used.
Last Updated 11/19/2025 12:00:58 AM