Overview
The Ask Ada Charts control integrates an AI-powered chat interface into the App Designer editor, enabling users to generate, configure, and refine charts through natural language queries against data domains. Instead of manually configuring chart queries and visualizations, users can interact with Ask Ada conversationally to create charts based on the information they want to analyze.
Charts generated through the chat are automatically displayed in the page layout, allowing you to immediately preview and apply the results. The control supports an iterative design experience where you can refine queries, modify chart types, and update visualizations without leaving the editor.
Ask Ada also enhances the chart creation process by automatically generating titles and descriptions, while identifying parameters from user queries to create dynamic filters that support more flexible data analysis. During the design phase, charts can be previewed using sample data, providing immediate visual feedback before the chart is published and used within the app.
Adding the control to your Page
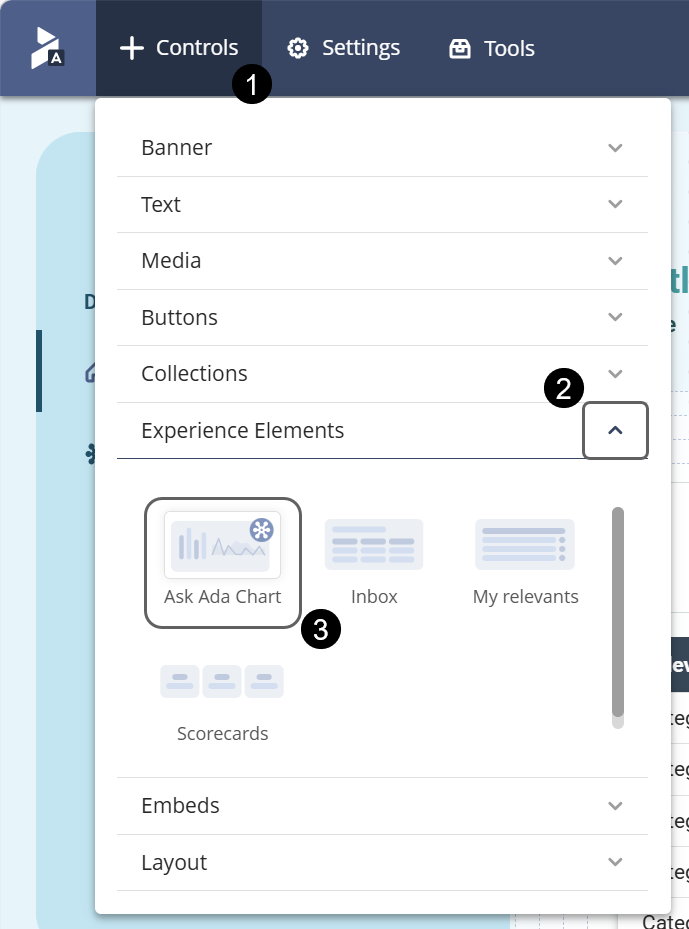
To add the Ask Ada Charts control to your app, open the Controls menu located in the upper left corner of the screen. Locate the Experience Elements category and click the expand icon to display the available controls. Drag the Ask Ada Charts control onto your page.
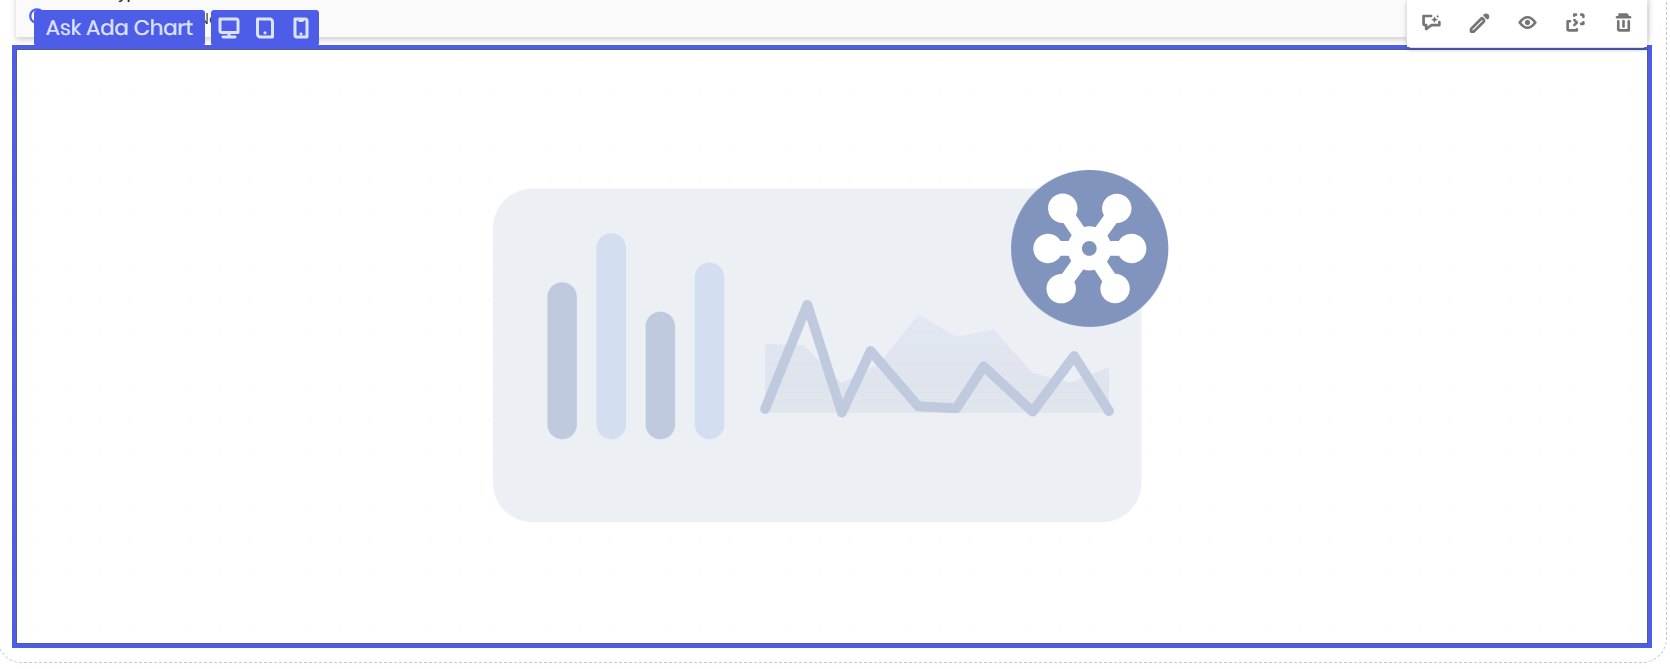
Once added, the control is displayed on the page as follows:
Managing the control content
After adding the control to your app, select a data domain and begin interacting with the Ask Ada chat. Use natural language prompts to generate and refine chart content based on the available data.
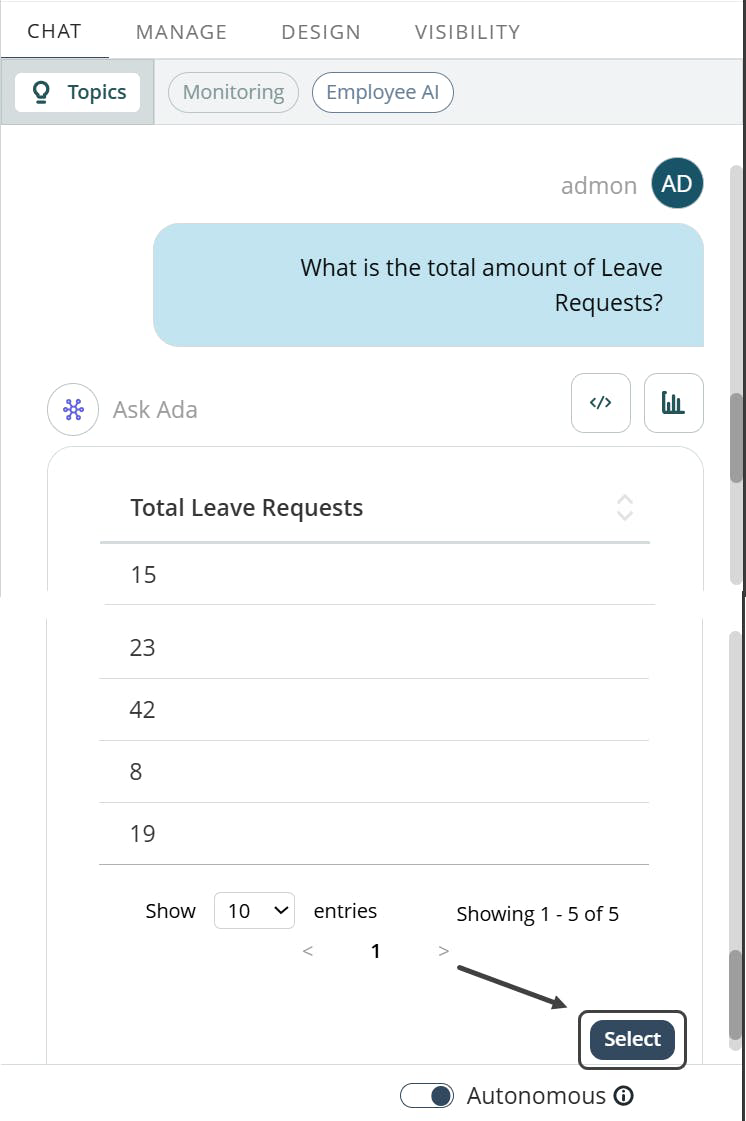
You can preview charts directly in the App Designer editor using sample data, allowing you to validate the visualization before applying it to the page layout. Once the chart matches your requirements, apply it and update the page layout. Remember to save and publish your changes to make the Ask Ada Charts control available in your app.
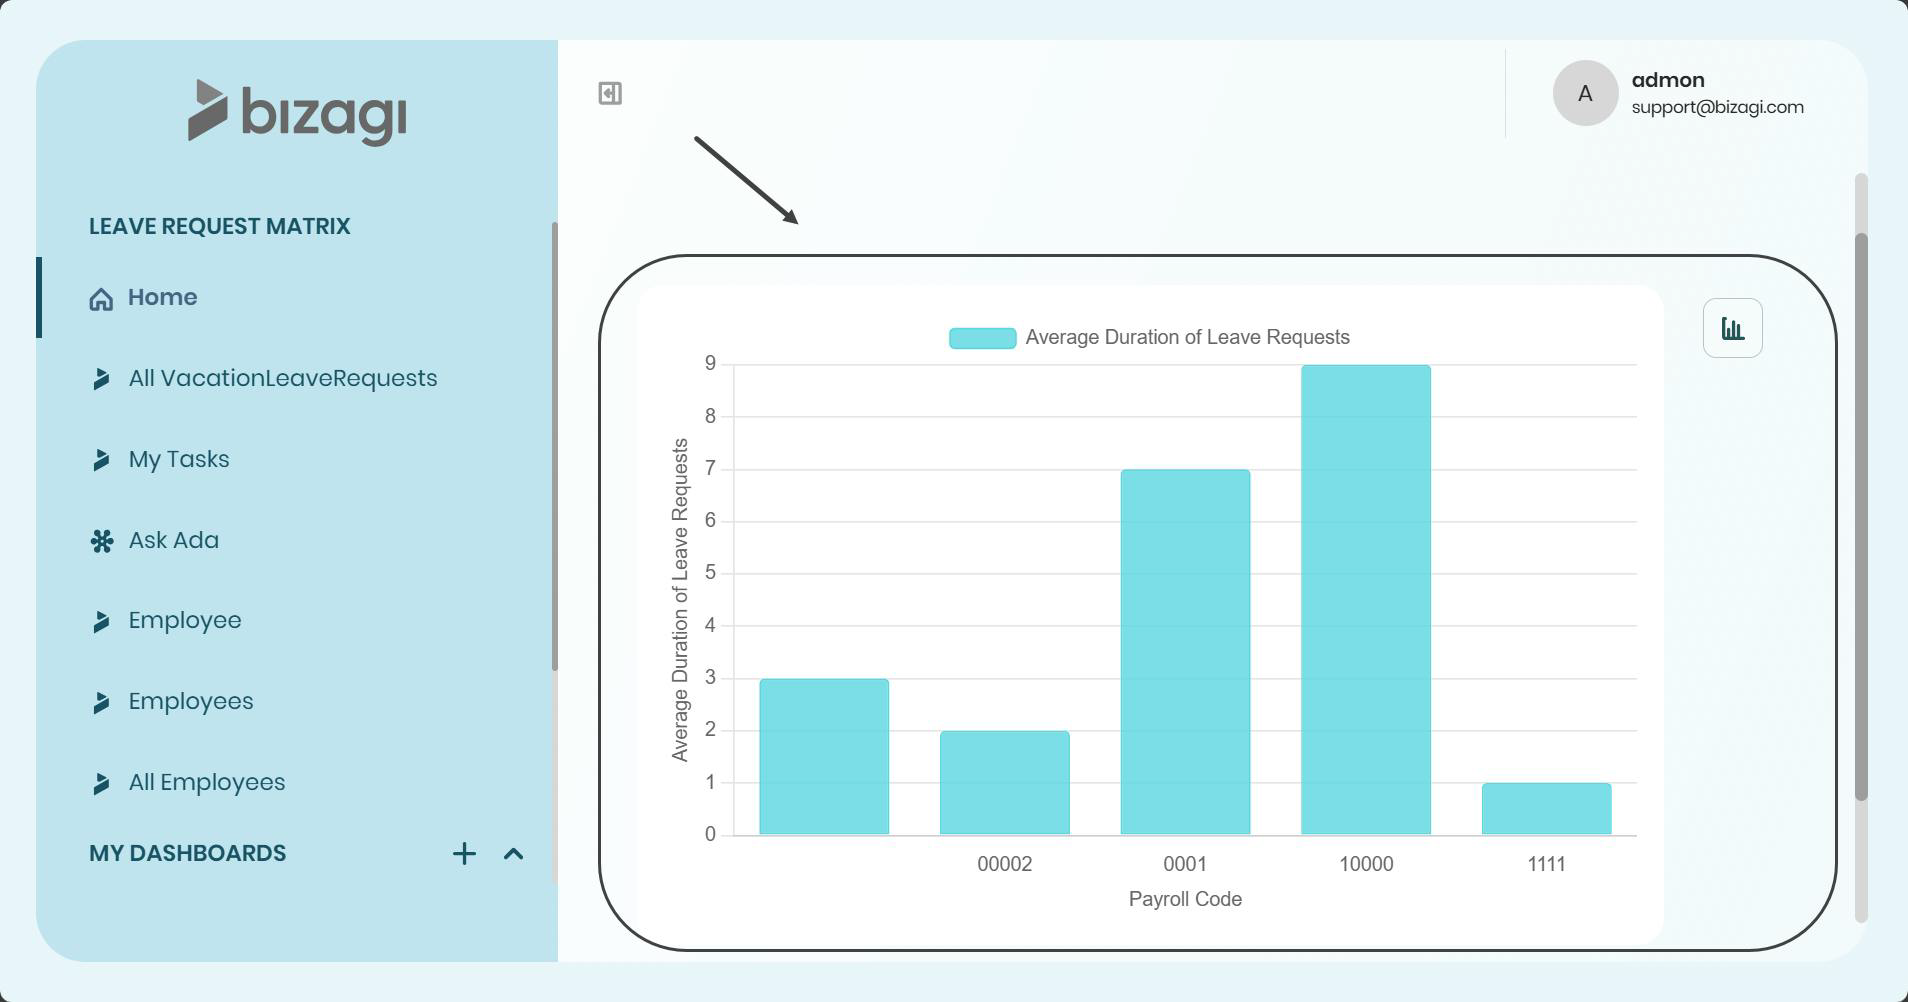
|
Sample data is available for preview purposes within the editor. |

Changing control properties
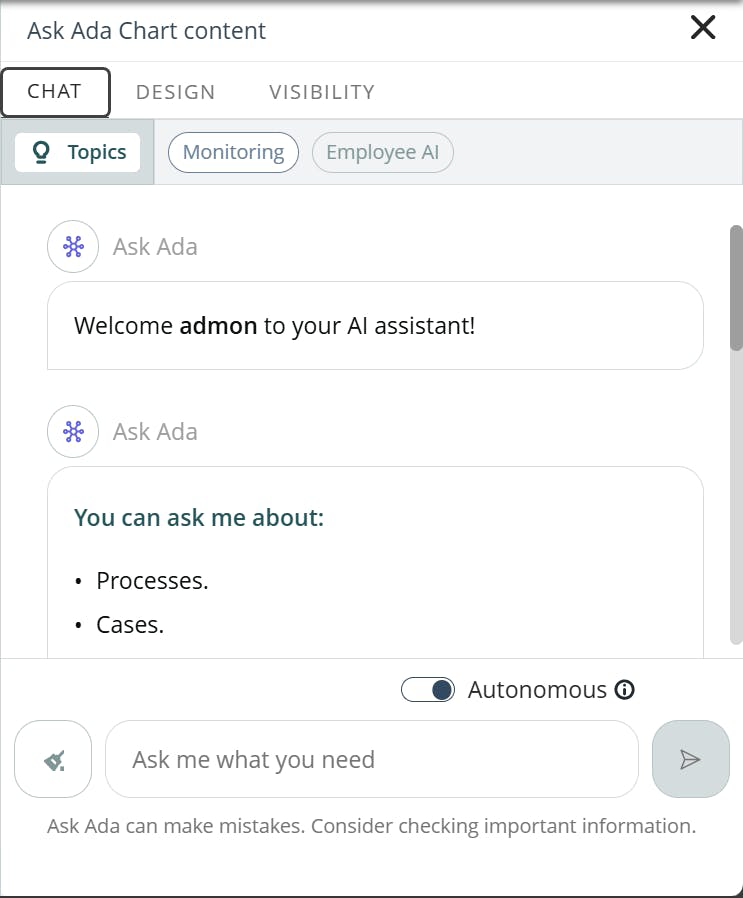
To modify the control properties, select the control and open the Chat tab. The App Designer editor allows you to review and edit the AI-generated title and description. You can also review the detected parameters and modify them to adjust the filters applied to the chart.
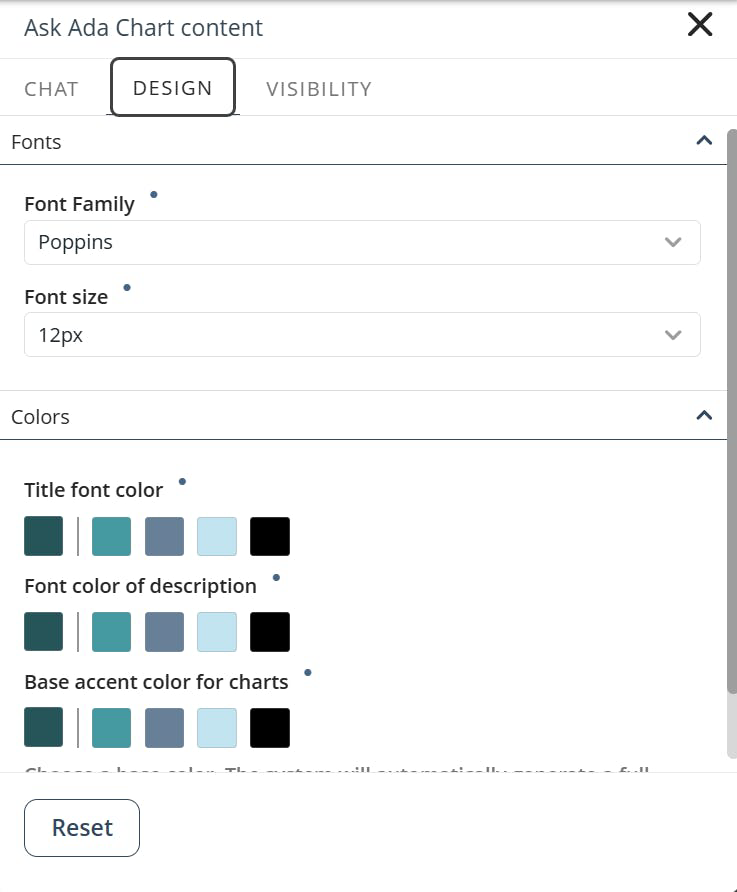
From the Design tab you can customize the chart appearance, including the default font, font size, and colors.
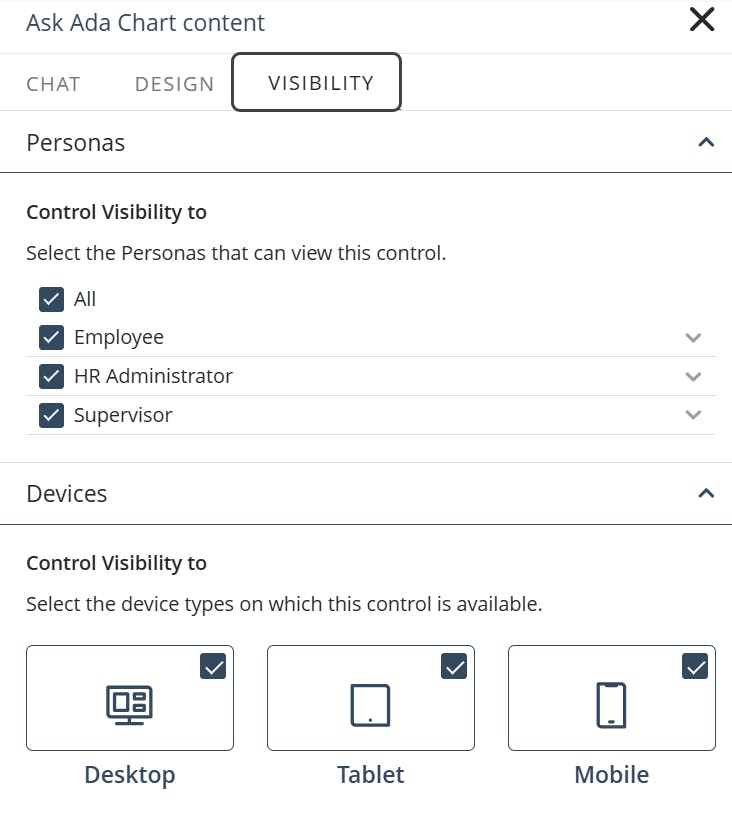
In the Visibility tab you can define which Personas can view the control and on which device types it is available.
Edit the control
Charts that have already been added to a page can be modified directly through the chat interface.
Select the chat icon of the chart control to open the conversation. The chat automatically loads the data domain associated with the chart and uses the current chart query as context. Continue interacting with the chat until you obtain the desired result, then apply the changes to update the control.
Considerations
Keep the following considerations in mind when working with the Ask Ada Charts control:
•You cannot reuse existing chart controls as templates for creating new charts.
•Queries generated within the editor can be previewed using sample data during the design phase. Real data is available when the control is published and executed within the app.
Last Updated 7/17/2026 3:00:48 PM