Overview
In Bizagi Apps, queries performed in Ask Ada can be managed by storing and grouping the results in customizable Dashboards, accessible even after logging out.
Each time you enter a query within a dashboard, the data dynamically updates, consistently presenting the latest information with each visit.
This article provides details on how to interact with the query result storage mechanism in Ask Ada Dashboards.
Before you start
Check you have set up the Ask Ada page within the App Designer editor. When publishing the app, you will find the My Dashboards section where you can create dashboards to store your Ask Ada query results.
Menu options for a result in the Ask Ada chat
Once you have a result from a query made on the Ask Ada chat, you can:
1.Save the result in a dashboard.
2.Switch the result display between a table or bar chart format.
3.Display the result information.
4.Export the result to an Excel spreadsheet file.
![]()
Save a result
Save a result is the first menu option and allows you to save a result in the dashboards. Once you have made a query within the Ask Ada chat, you can save the results by clicking the Save button located on the right side of the result.
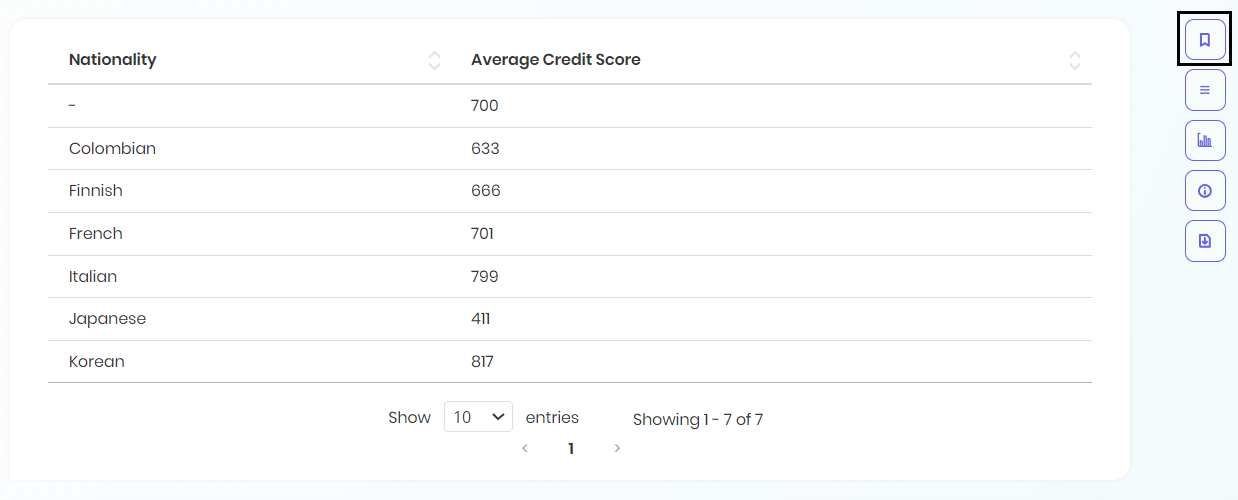
This action opens the Save in dashboard window, where you must choose the dashboard to store the result. You can save the result in an existing dashboard or create a new one.
In this window, you must enter the following data:
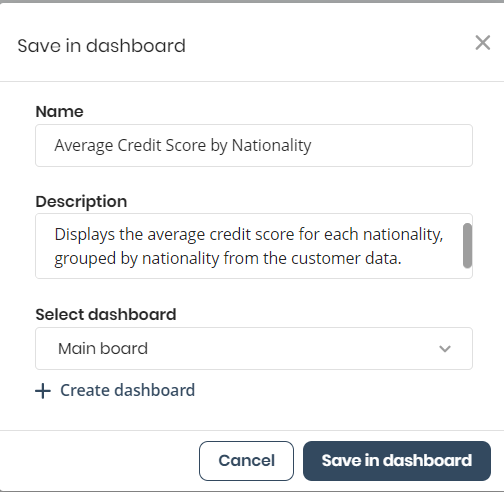
•Name: Assign a name to the result you want to save.
•Description: Provide a concise description of your saved result to add context.
•Select dashboard: Upon selection, a drop-down menu appears displaying existing boards where you can store your result.
•Create a Dashboard: Allows you to save the result to a new board. Upon clicking, a new page opens, prompting you to input a name and description for the new board.
Change the display of the result
The second menu option allows you to switch the display of your result between a table or chart format.
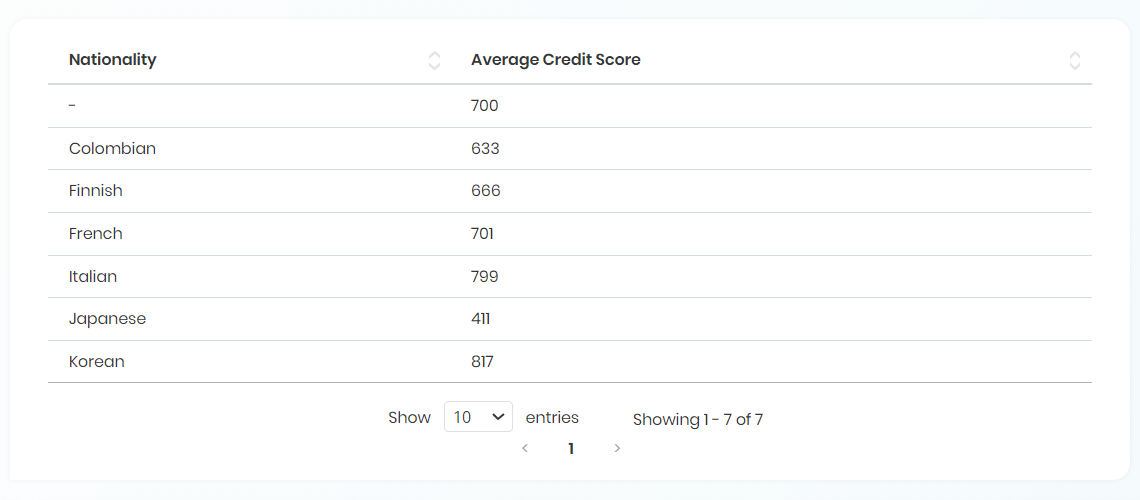
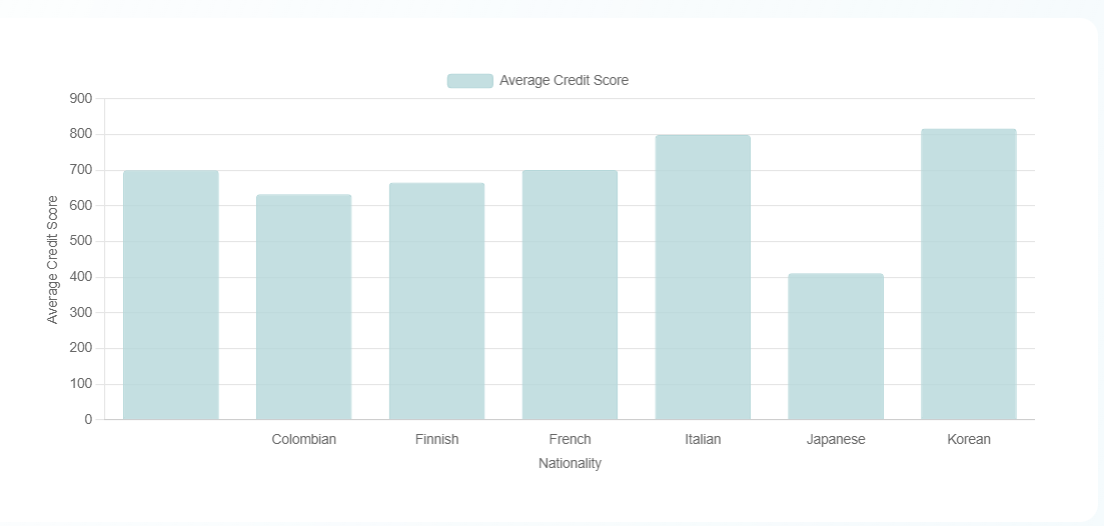
This option is also available for results that are stored within a dashboard.
Change the type of chart
You can change the chart type for each chart-based response. To do this:
1.Click the Show chart button.
2.Select the chart you want to use.
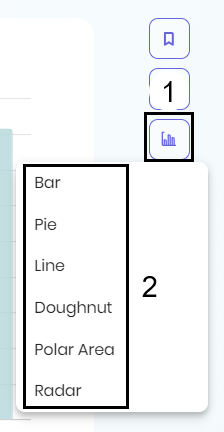
You can choose between the following types of charts:
•Bar
•Pie
•Line
•Doughnut
•Polar Area
•Radar
•Funnel
•Stack Bar* (This applies only to graphs where the data shares a single common attribute.)
Result information
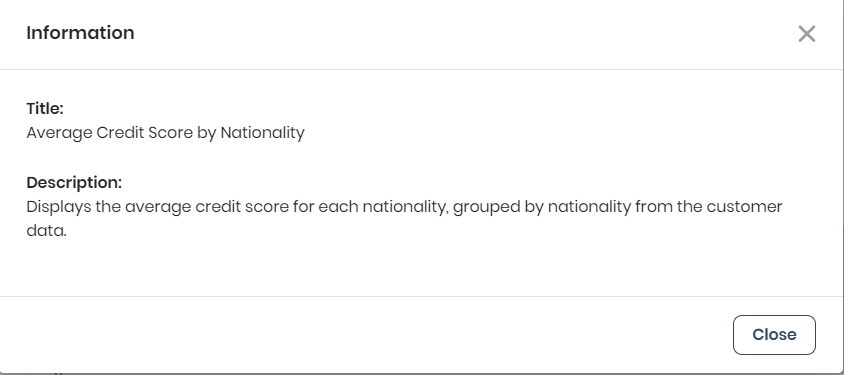
The third menu option allows you to consult and obtain basic information about the result, such as the title and description added to it.
Last Updated 5/10/2025 4:24:21 PM