The Analytics Report is an analysis tool that presents a graphically view of closed cases. Analytics is divided in two perspectives: Process Analytics and Activity Analytics. All reports have drill-down functionality showing individual cases.
IMPORTANT: Analytics is only enabled when the Processes and Activitys Duration are configured. In this way Bizagi can establish a comparison between expected and real execution times.
|
The real execution time of a Process or Activity is calculated based on the Standard Working time schema, regardless the existence of other time schemas. |
Process Analytics presents performance indicators on a Process level for closed cases.
You can choose any Process and filer by any of the Dimensions defined previously. The cases included in the report will be those cases closed in the time filter specified, located at the bottom of the screen.
Process Analytics presents five reports:
•Cycle Time: analyze the cycle time of closed cases for a given Process
•Duration Histogram: present a summary of how many days closed cases have taken to complete. Report only gives a view - does not allow the user to control the time.
•Process Activity: measure the efficiency ratio of closed cases versus created cases.
•Activation Ranking: compare the number of instances (created cases) for each Process in the project.
•Frequent paths: identify the paths most taken in a specific Process.
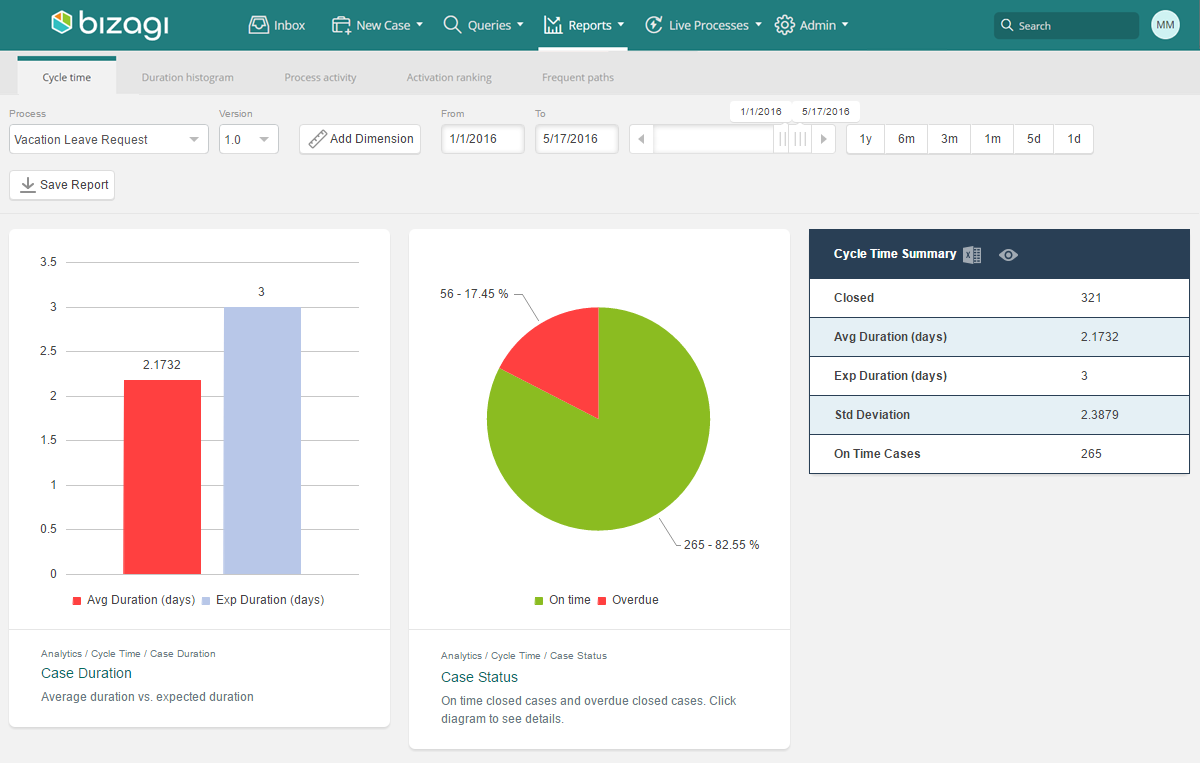
The report contains the Cycle Time summary that lists the number of closed cases for a chosen process by average duration, expected duration, standard deviation and number of cases completed on time. Completed cases DO NOT include aborted cases.
The Case Duration histogram compares the average time with the expected duration time of all closes cases.
The Case Status pie chart measures the percentage of cases closed on time versus the percentage of cases closed overdue.
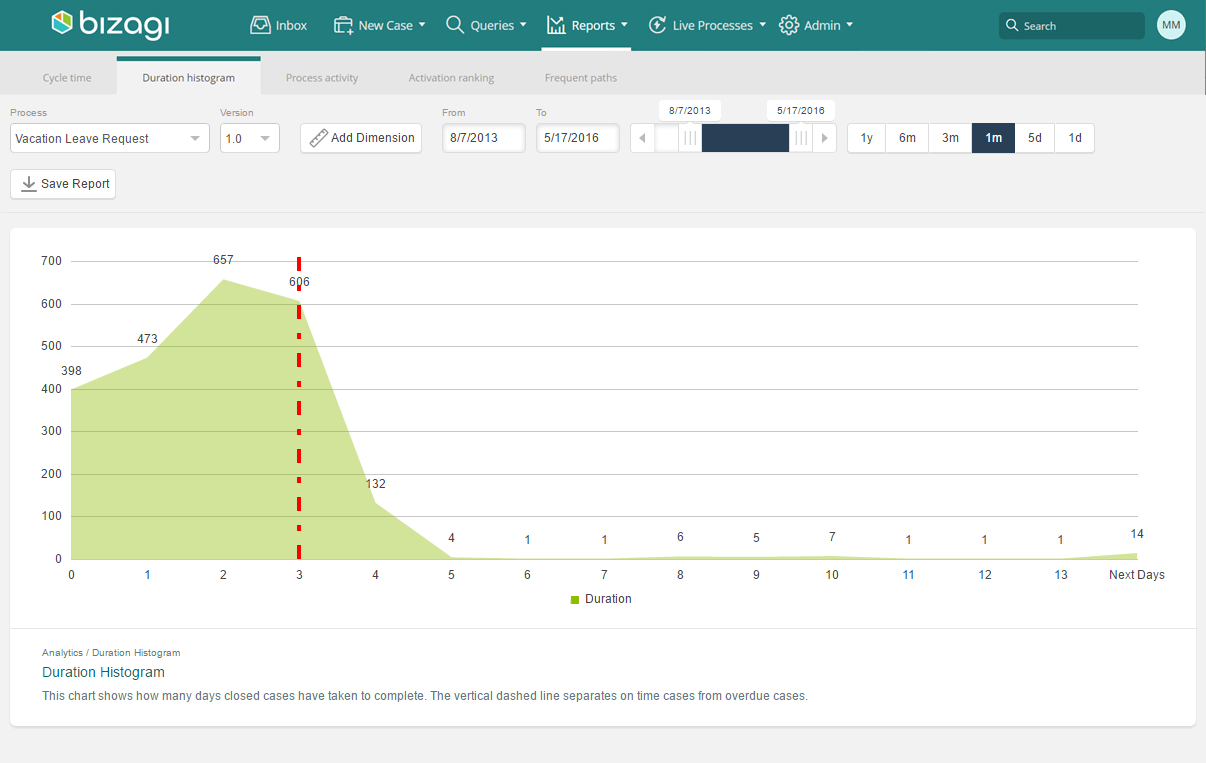
This report shows the number of days closed cases have taken to complete (excluding aborted cases) .
The vertical dashed line represents the expected completion time of the Process and separates cases closed on time from those overdue.
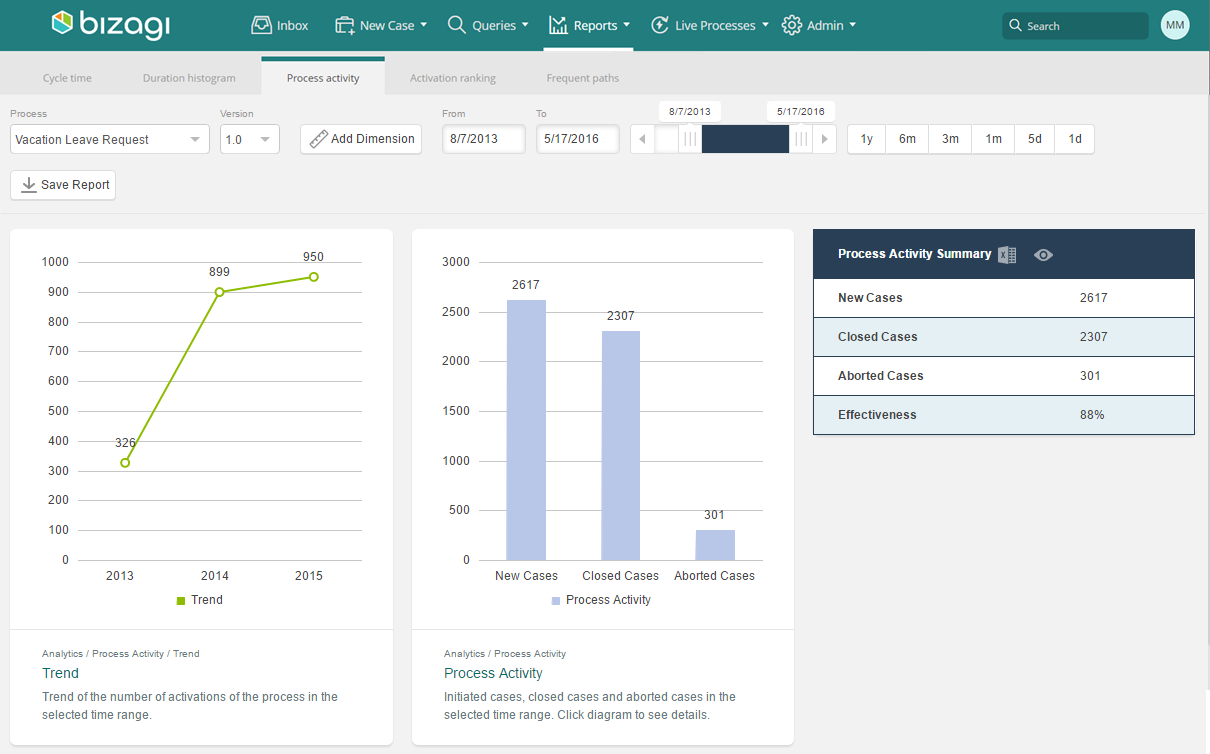
This report displays a summary containing the number of cases created (Opened), the number of completions (Closed) and the number of aborted cases (Aborted) during the data range selected. It also shows an efficiency value (Effectiveness) obtained from the ratio of closed over created cases. The Process Activity histogram compares the Open, Closed and Aborted cases in the selected date range. The Trend graph shows the number of cases created in the selected date range.
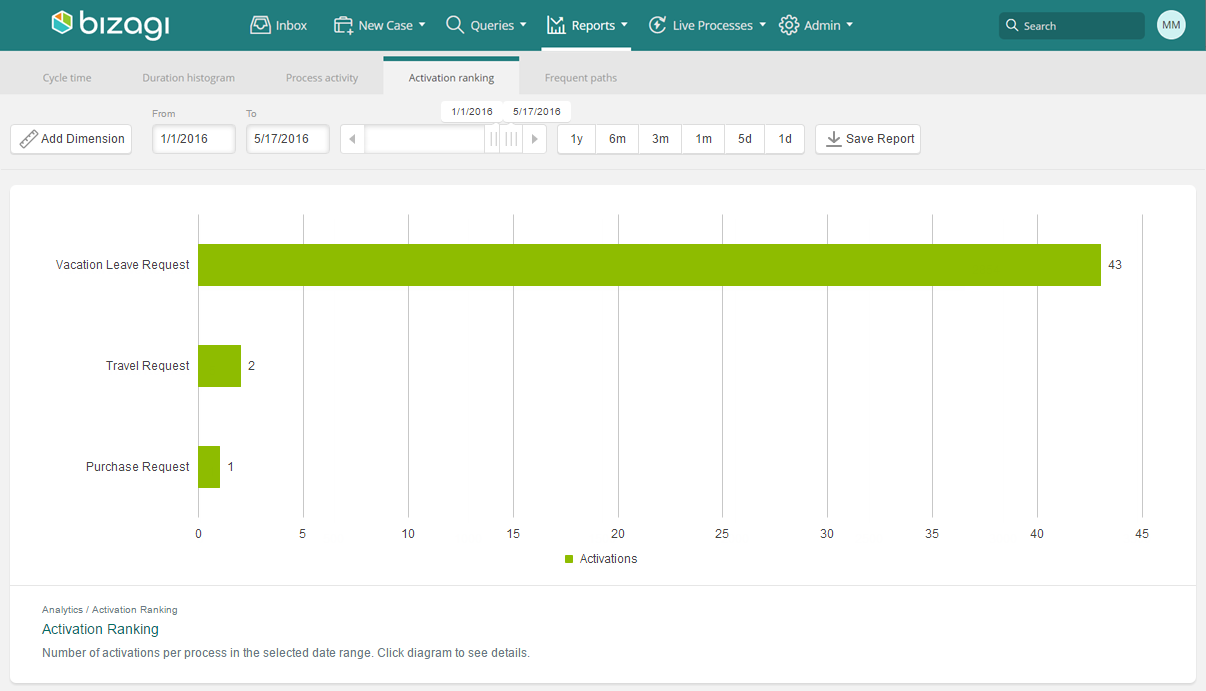
A bar graph shows the number of instances created (Activations) for each Process in the project, in the selected date range.The graph is sorted by descending number of Activations.
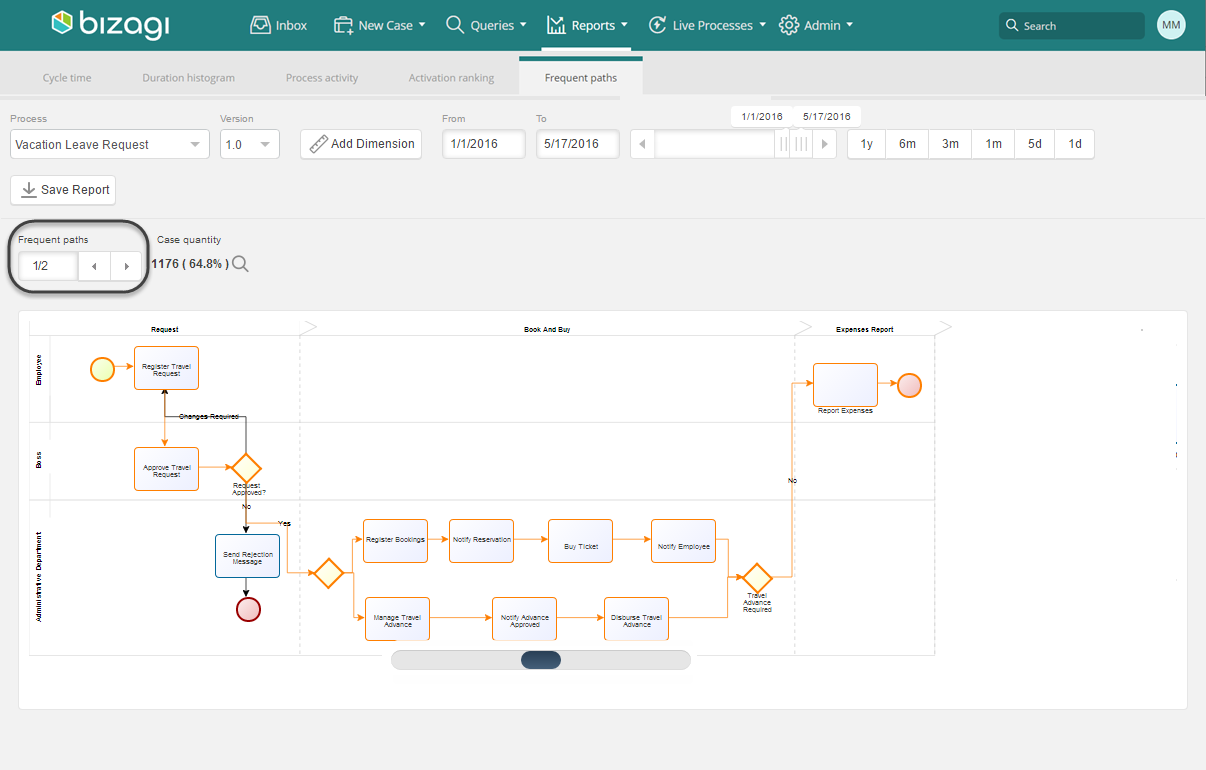
This report shows the ten most frequently used paths in a specific process. This option allows you to identify the business cases that are more common and make decisions based on these statistics.
As an example, we are going to use the Travel Request Process. The manager of the Human Resources area expects that most of the requests are indeed approved and need Bookings. He checks the Frequent Paths for the Process to verify this conjecture. Paths are only available if there are closed cases. Ongoing cases will not be displayed in this report.
Bizagi will identify and show the most common paths taken in the Process. It calculates the percentage of closed cases that went through a specific path among all the closed cases for the Process (excluding aborted cases).
In the example, the manager can verify that 64.8% of the total 1814 cases have passed through the highlighted path (approved with travel advance and with bookings). From this result it is obvious that the majority of requests have been approved (as expected) and that many of them require an advance. To reduce these manual activities the Manager could propose providing Corporate Credit Cards for everyone traveling.

You can also verify which other paths have been used and get the percentage of use. Bizagi will highlight each one of the other paths as you select them.
Continuing with the Travel Request Process, this report shows the second path followed as indicated by the path count at the top right i.e. "1/2" The manager can verify that 35% of the cases were not approved.
This report presents performance indicators based on closed Activities that belong to closed cases (not including aborted cases). Activities can be filtered by Process version and Dimensions.
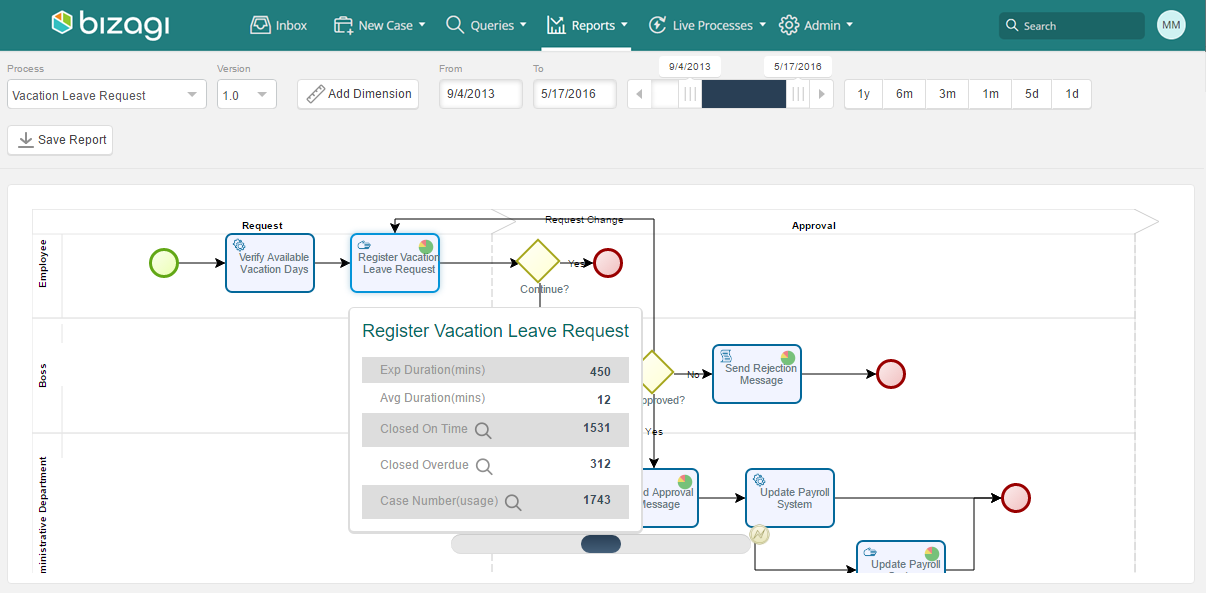
Select a Process to analyze its Activities. For all Activities (marked with a pie chart icon), the number of on time and delayed completions across all cases are displayed. These Activities DO NOT include aborted cases.
Select a Activity to display a summary of its measurements: average duration, expected duration, number of Activities closed on time, number of Activities closed overdue and cases count (number of closed cases that passed through the Activity).
Cases Details
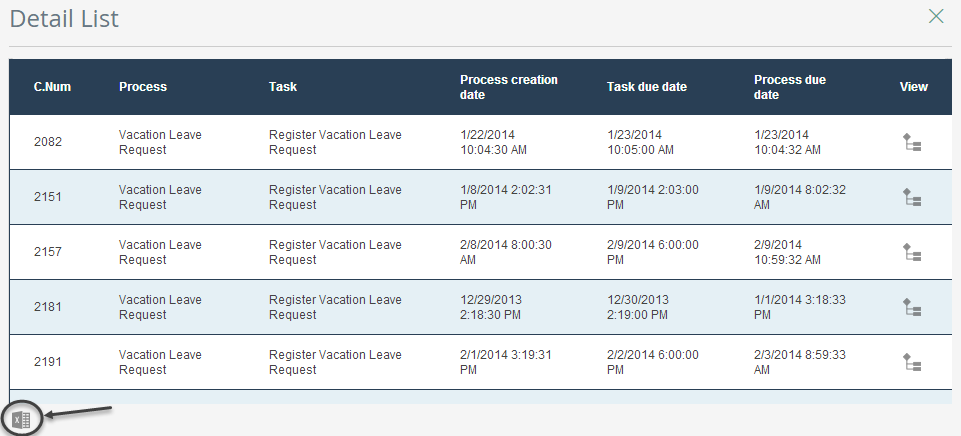
Click on any of the reports charts mentioned above to display a list of all the cases relating to that part. In the case list, click the Case Number to drill down to the case and view the Summary Form. This list can be exported to Excel by clicking on the link at the bottom left of the screen.
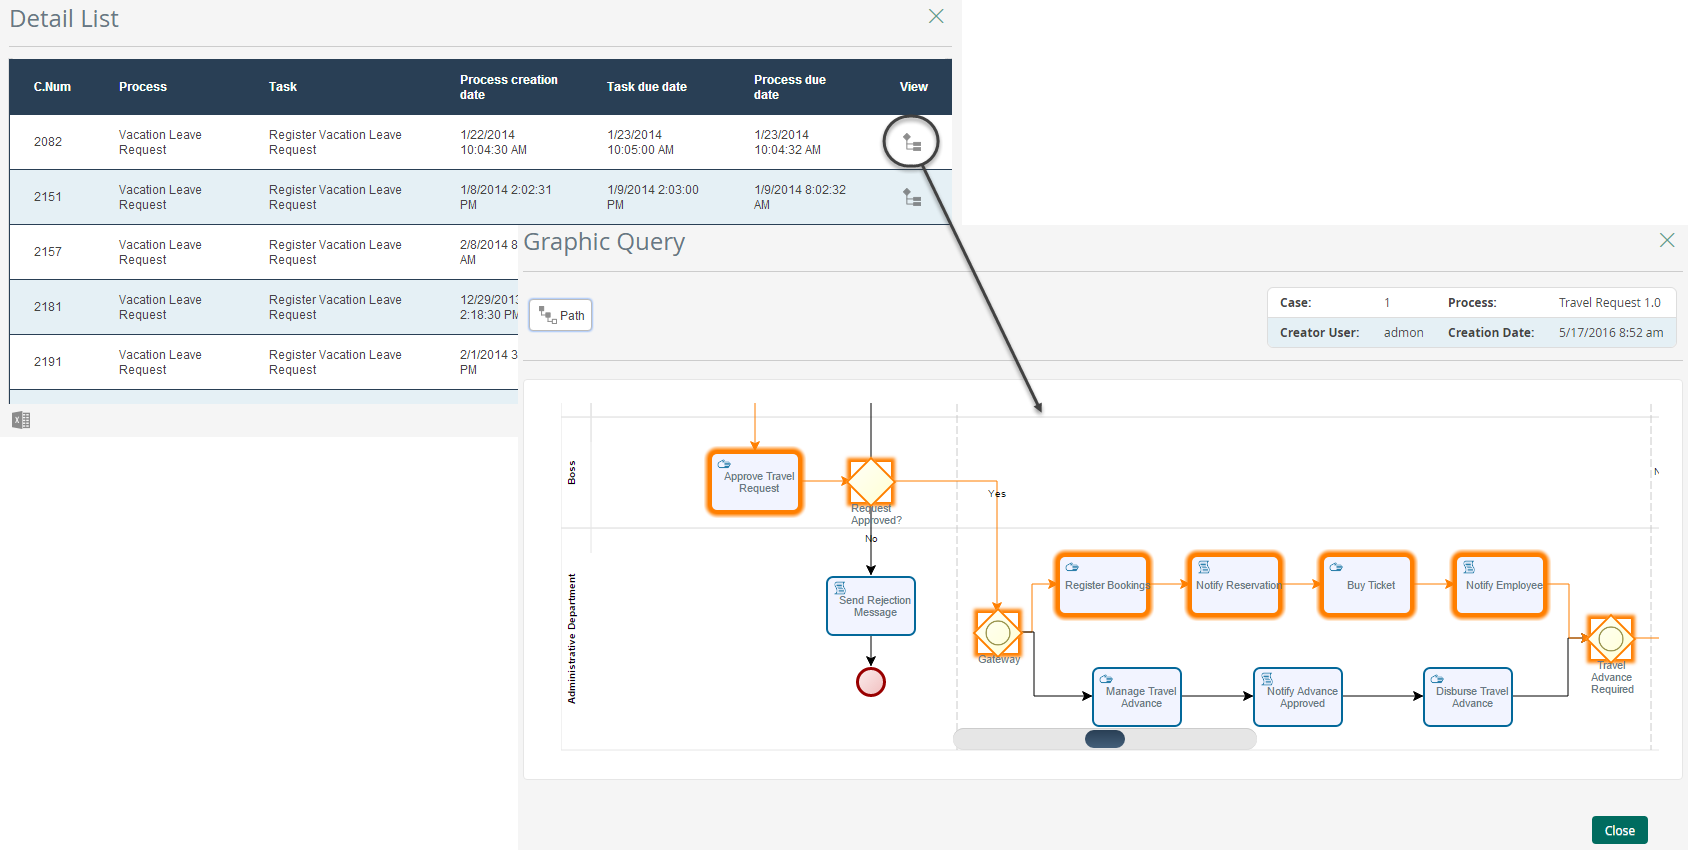
Click in the View column to see the case instance of the Process and its path of execution.
Click in the Admin column to access the Case's administration page in order to re-assign it or abort it.
Last Updated 4/5/2023 5:55:23 PM