Sensors are a set of management indicators to optimize the performance of business processes. It allows for the review and control of the following:
•Time and number of cases between any two Activities in a Process.
•Number of activations of a given Activity.
•Service Level Agreements or SLA comparisons.
The indicators are presented by means of Stopwatches and Counters.
Stopwatches
Stopwatches determine the number of cases that have passed through a specific path and the time it has taken to do so. The time is derived from the first time it enters the starting Activity until such time it leaves the ending Activity. Only the cases that have completed the whole path are considered by the reports. In a single case it is possible to have the same path repeated several times. Thus, a single case can have several instances of a Stopwatch.
|
The time a case takes to pass through a specific path is calculated based on the Standard Working time schema, regardless the existence of other time schemas. |
There are five different reports for each Stopwatch:
•Cycle Time Summary: This table shows the number of times the selected path was completed, the minimum time it took as well as the maximum time and the average duration. According to the SLA defined in the Stopwatch, the table will show the number of cases that met the SLA (On time) and the number of cases that did not meet the SLA (Overdue).

•Level of Service: Shows for the selected stopwatch the percentile rate of completed cases that passed through a specific path during a time period of 0 to 6 days and over.

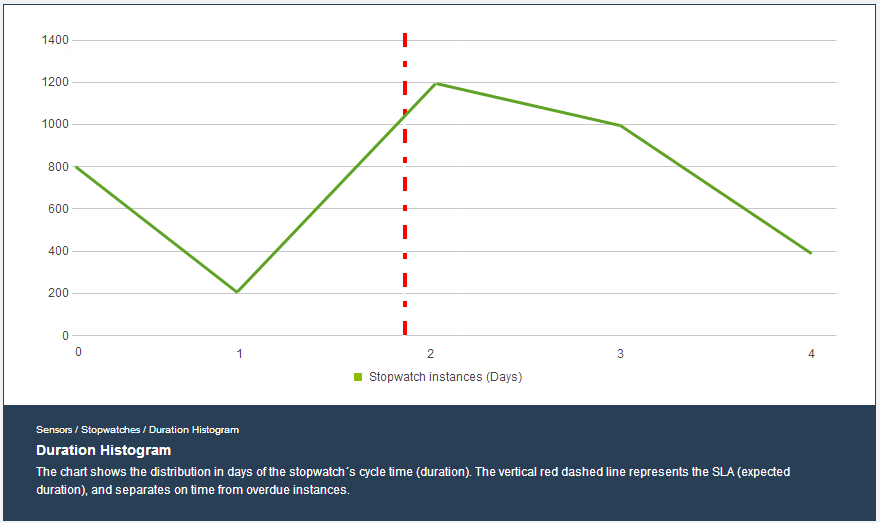
•Duration Histogram: This chart graphically shows the days the stopwatch instances took to be completed. There is a vertical dashed line that separates on time from overdue instances.
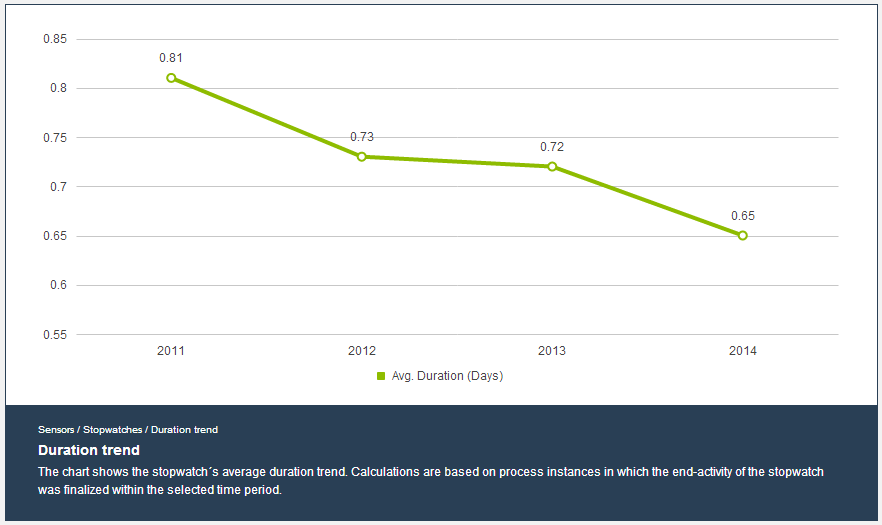
•Duration Trend: This chart graphically shows the average duration time of the stopwatch in the selected time range (10 day period).
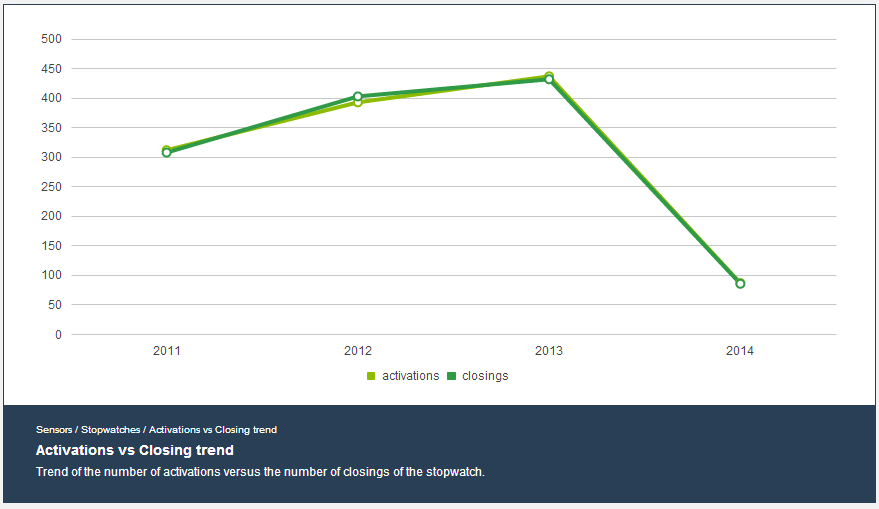
•Activations vs Closing trend: The stopwatch in the selected time range combines the trends of the number of activations and the number of closures.
|
Important Stopwatches information: •Stopwatches are independent for each end user. Each user defines the paths that he or she considers necessary. These are created in the Work Portal. •You can choose to filter the report by any of the Dimensions previously defined. •You can define a different start and end date for the time filter. The default is a 10 day period commencing on the day the Stopwatch is created, ranges cannot be changed. •Each Stopwatch can be deleted or edited at any time. •The Stopwatches can be exported to Excel. |
Counters
Counters are selected for a specific Activity in a Process to obtain the number of times the Process flow has passed through it. This Sensor will be useful to determine indexes of re-processing and loops. This feature will provide data to optimize Processes, identifying activation trends, counts and a list of the involved cases.
Counters are calculated in two different ways:
•According to the Case Creation Date: This ONLY count the cases that go through the selected Activity and that have been created during the chosen period of time. That is, the Counter takes into account the cases that were created during the chosen time period and activated the selected Activity.
•According to the Counter activation Date: This Counter will count ALL cases that go through the selected Activity regardless of the creation date. That is, any case, either created BEFORE or during the chosen time period, that activated the selected Activity will count.
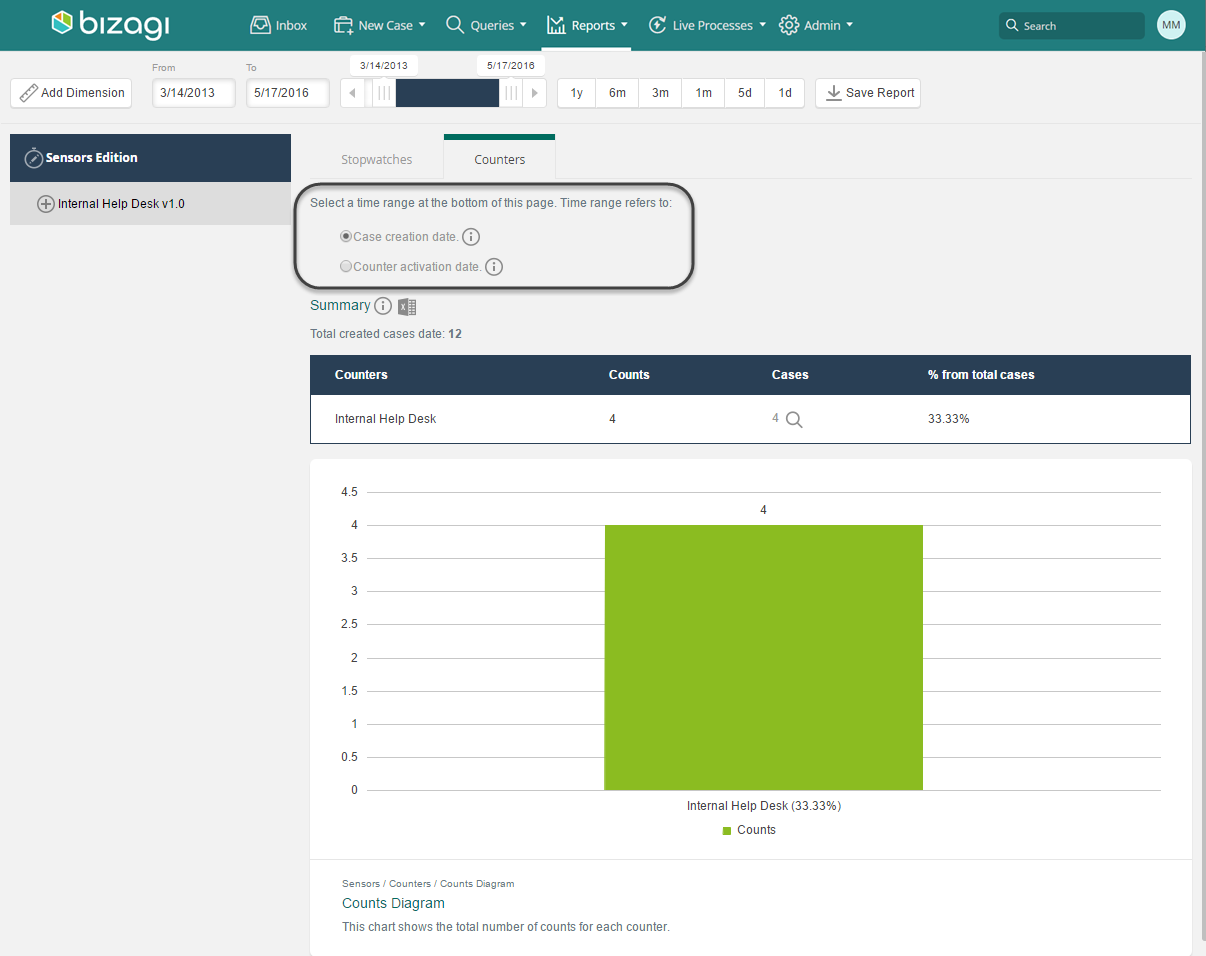
Initially the Counters reports are displayed together for each Process, with the Process name collapsed.
Different charts are presented when the Process name is not collapsed.
The collapsed Process will display two reports:
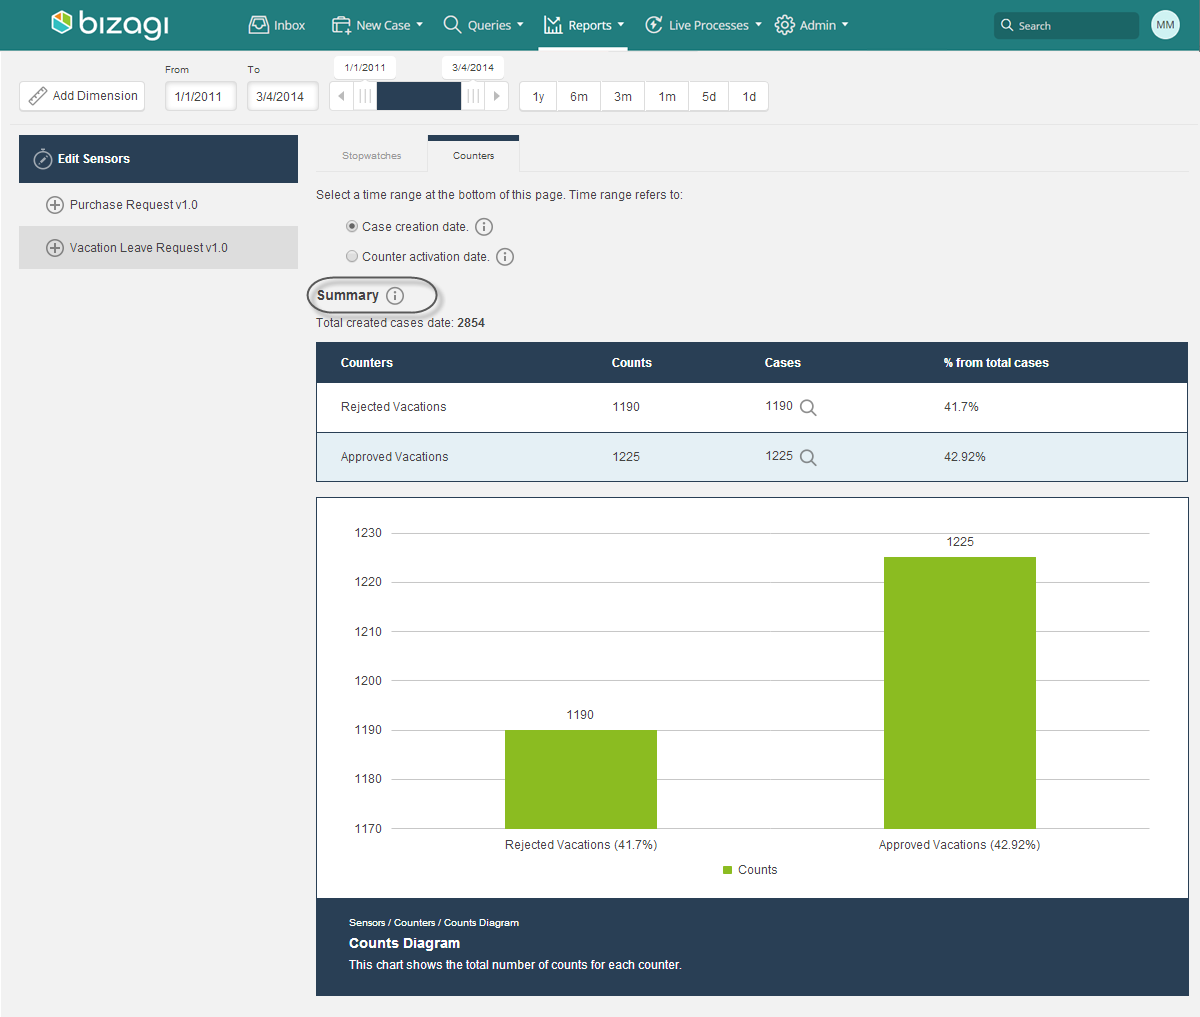
•Summary: This table shows the measures of all counters. Each counter will display the count of activations. A case might activate the same Activity more than once, and it will count each one. So, the number of cases will always be less than or equal to the Activity Count. There is also a percentage showing how many cases went through the counter out of all the cases.
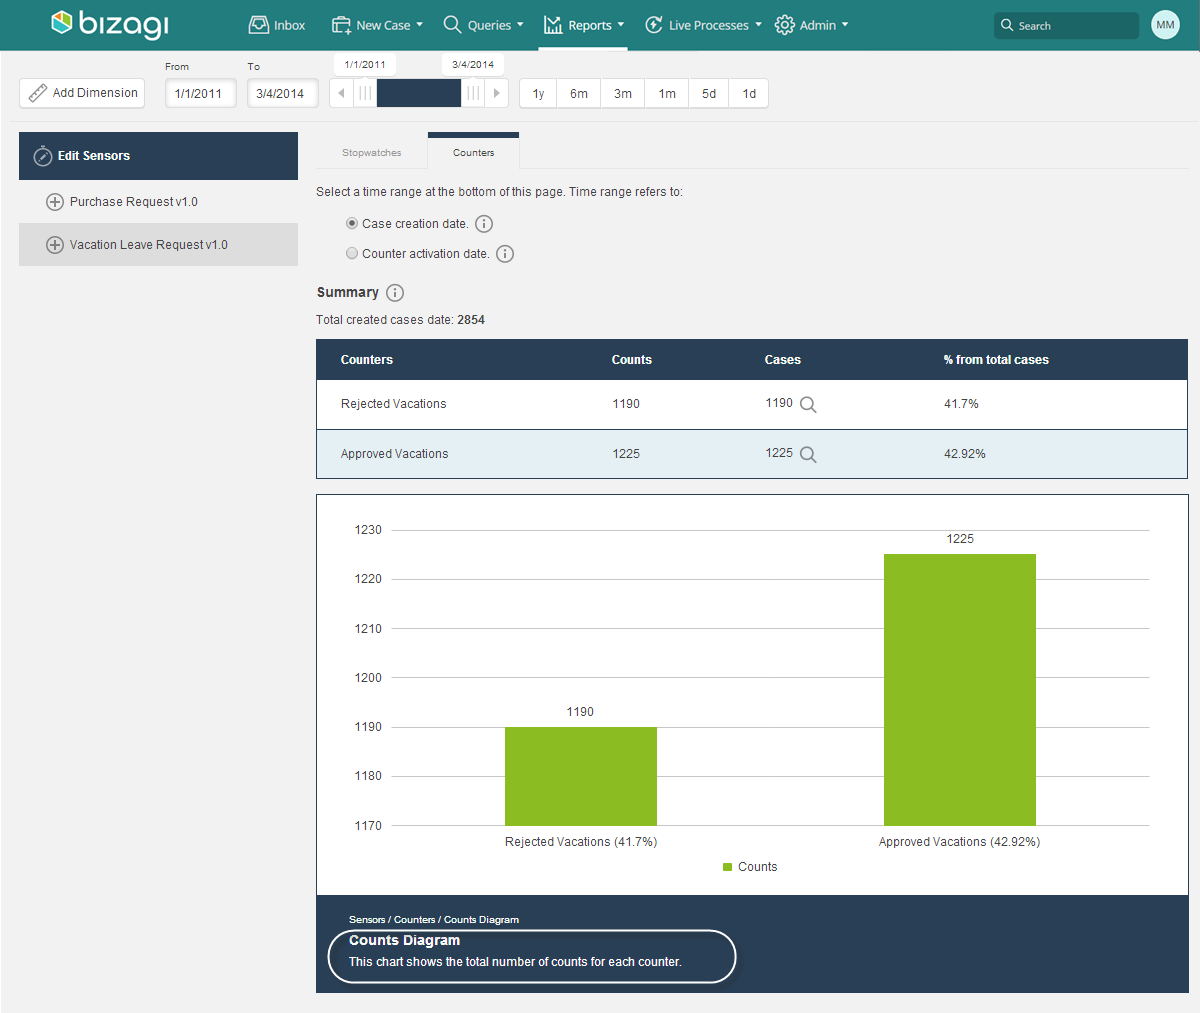
•Counts Diagram: This chart is a Histogram that displays the total count for all Counters of the selected Process.
Individual Reports
When you expand the Counters of a Process, you will be able to access the individual counter’s information. Each counter will have two reports:
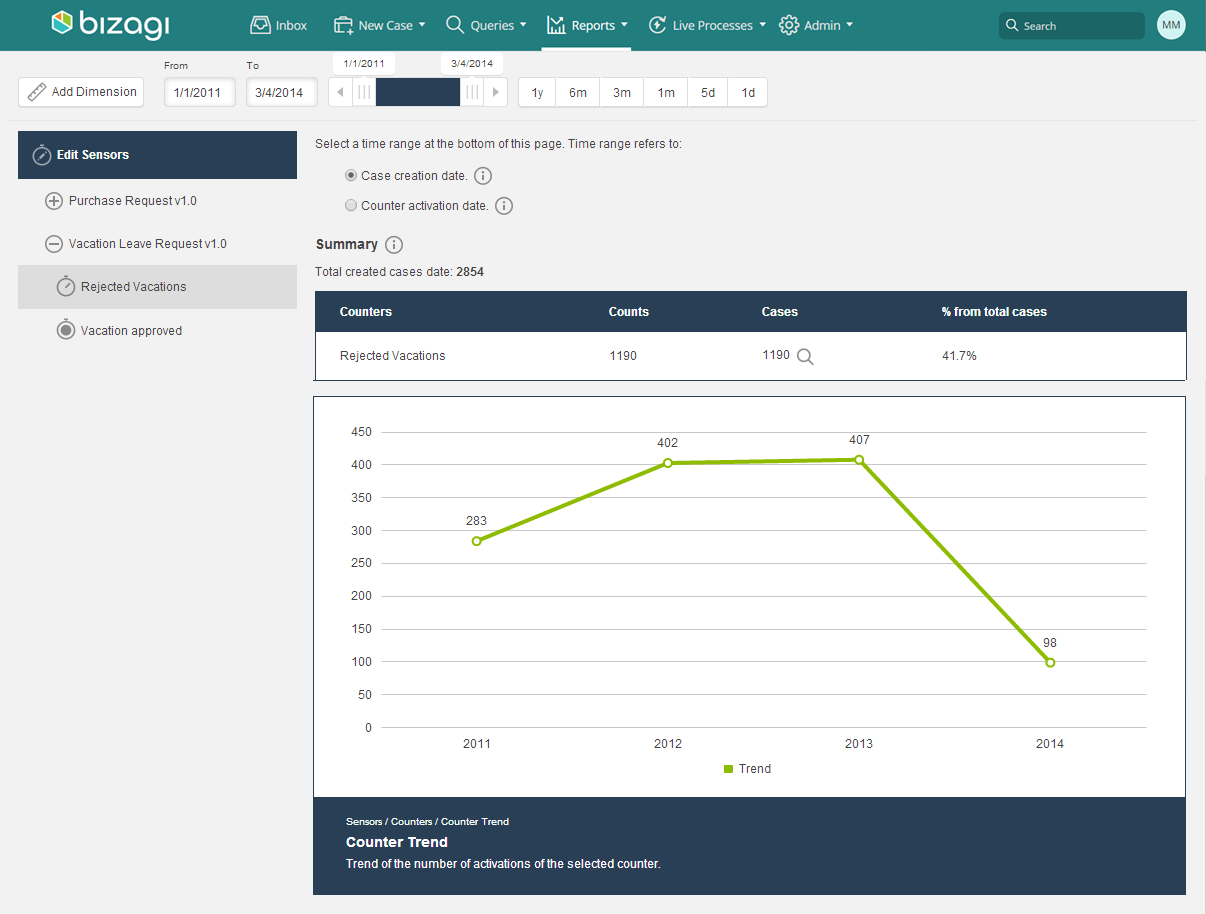
•Summary: This table shows the number of times the selected Activity was activated and the number of cases that had the Activity. A case might activate the same Activity more than once, and it will count each one. So, the number of cases will always be less than or equal to the Activity Count. There is also a percentage showing how many cases went through the counter out of all the cases.
•Counter Trend: This chart graphically shows the trend of the number of activations of the Counter.
|
Important Counters information •Counters are created by the user who defines the paths that he or she considers necessary. These are created in the Work Portal. •You can choose to filter by any of the Dimensions defined previously. •You can define a different start and end date for the time filter. The default is a 10 day period commencing on the day the Stopwatch is created, ranges cannot be changed. •Each Counter can be deleted or edited at any time. •Counters can be exported to Excel. |
How to Create Sensors
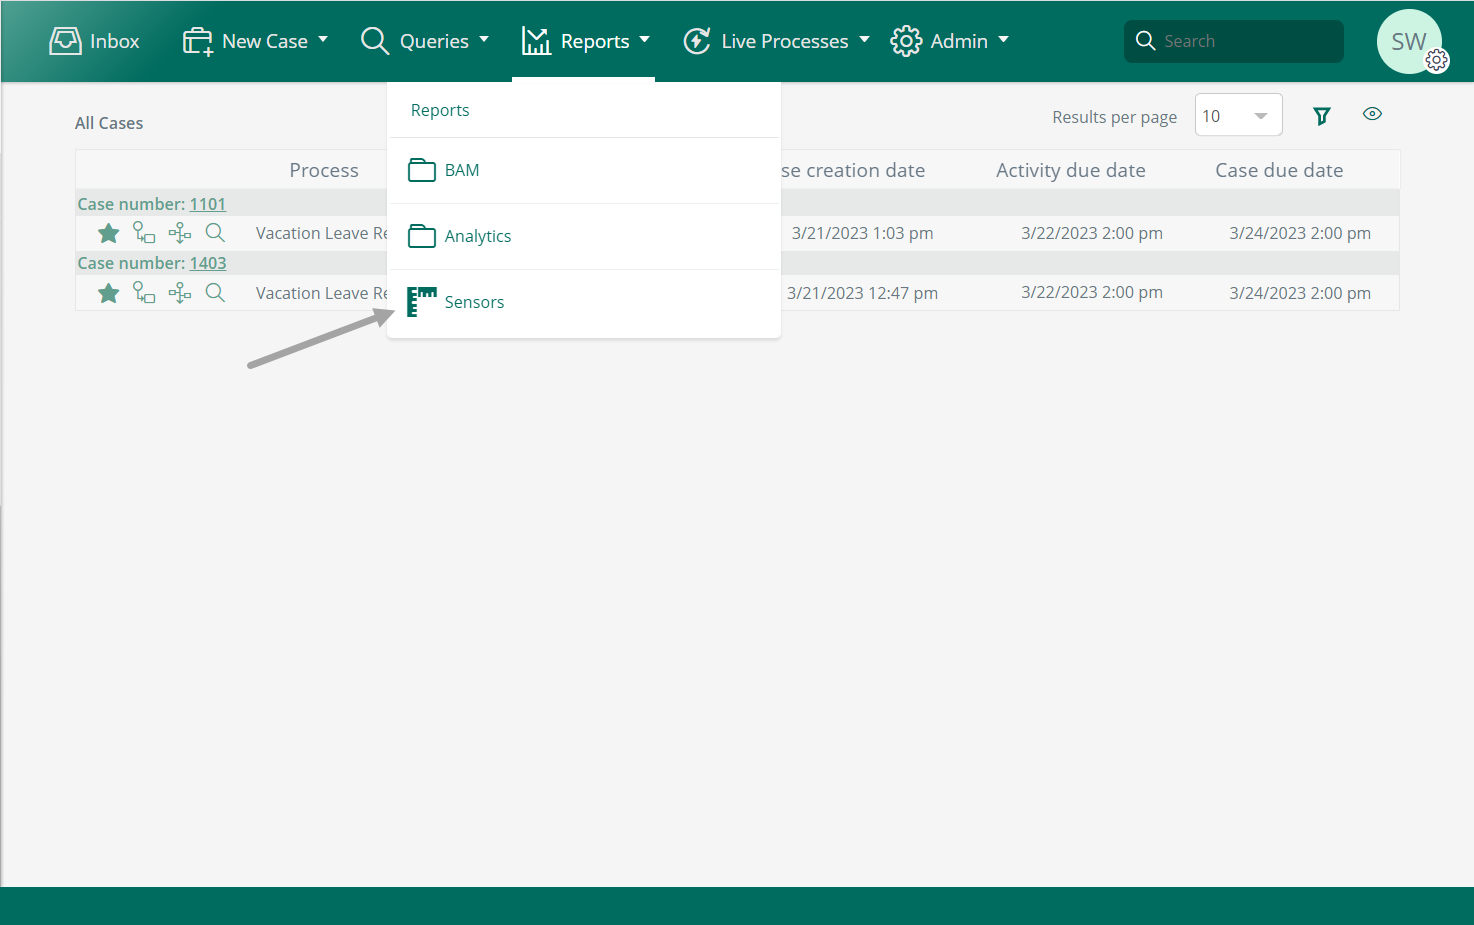
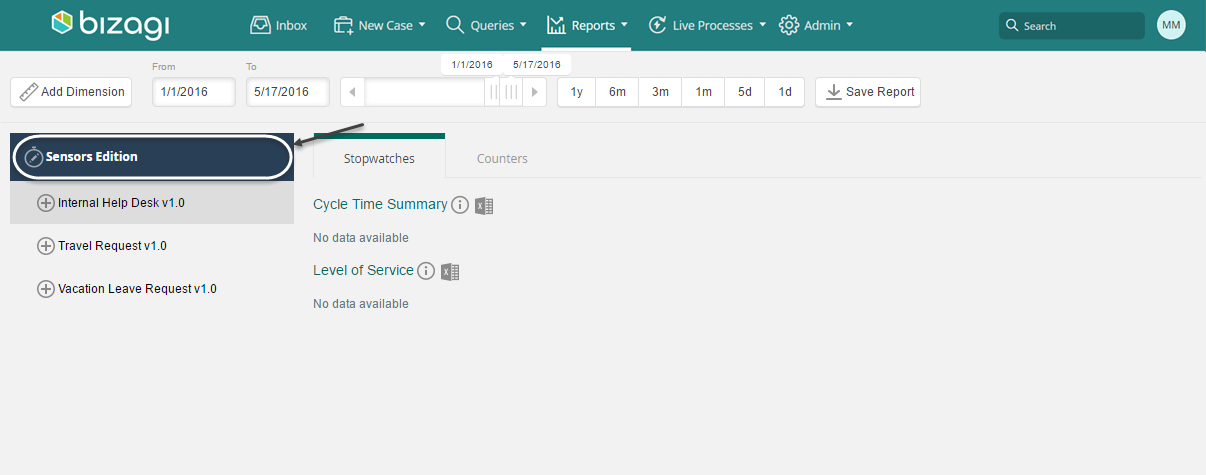
1. Go to the Work Portal and select Sensors from the Report Menu.
2. In the new window click Edit sensors to create a new one.
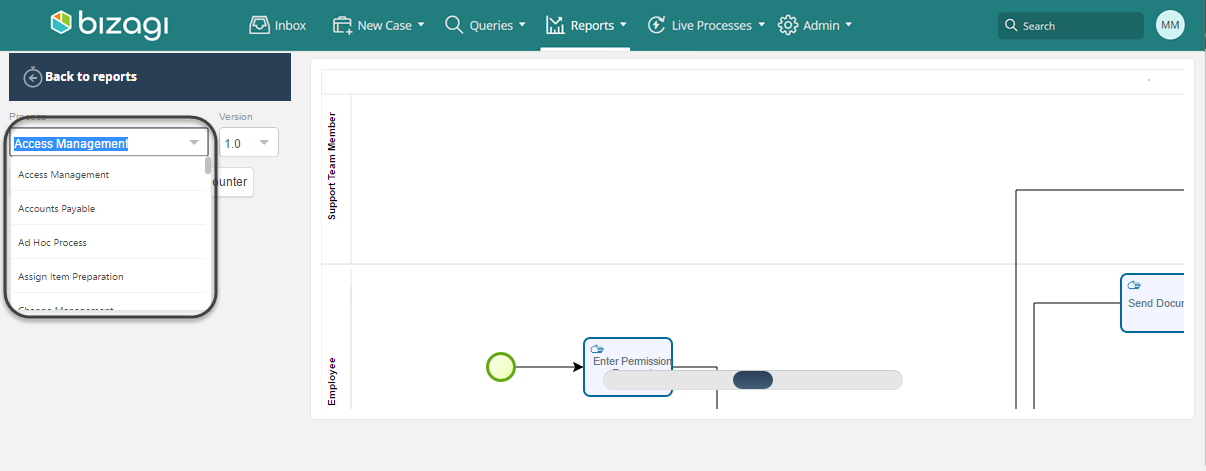
3. On the left select the Process to which you wish to add the Sensor from the drop down-list.
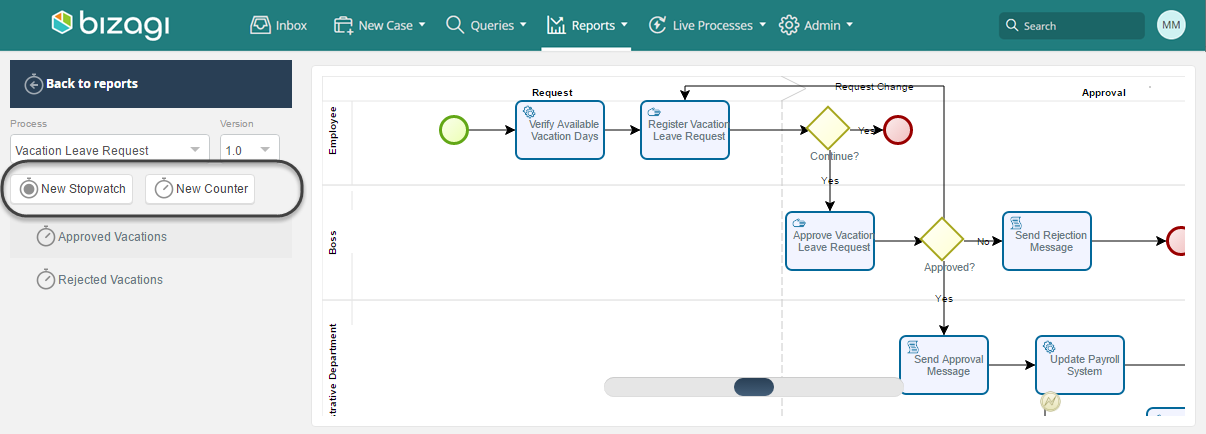
4. Click the New StopWatch or New Counter button according to the Sensor you wish to create.
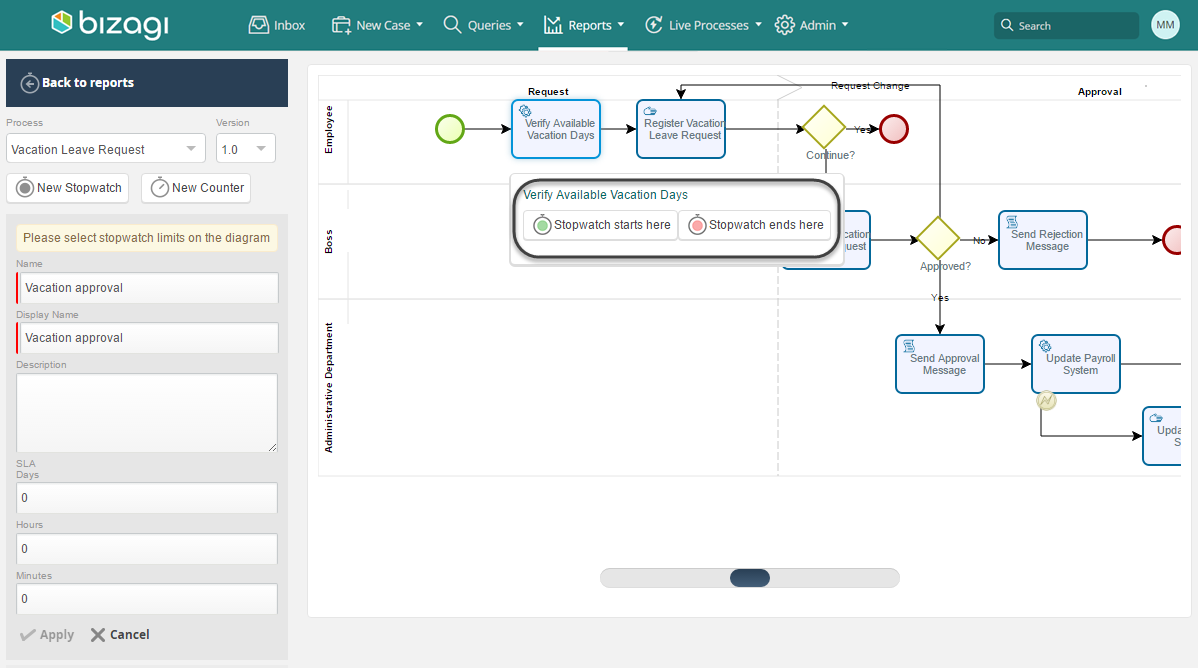
5. Select the necessary points of the Process for the Sensor as follows:
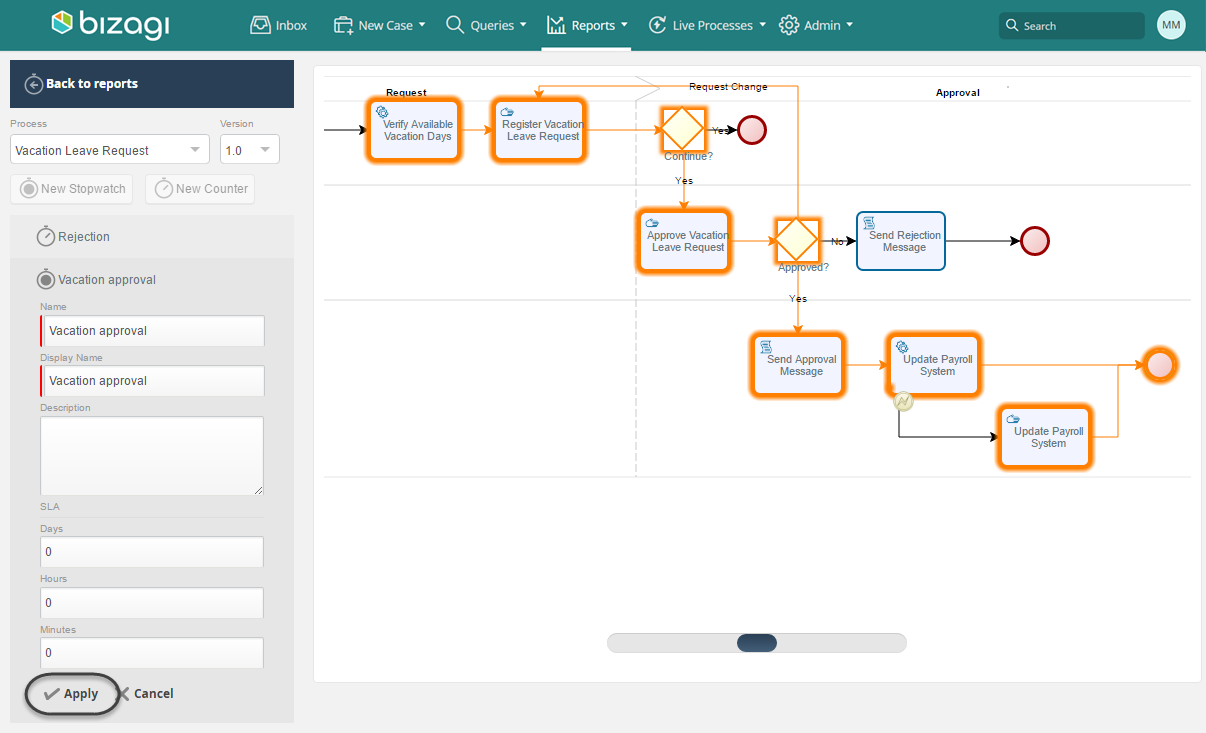
•If you are creating a Stopwatch define where in the Process it starts and where it finishes.
•If you are creating a Counter define the Activity that will be counted.
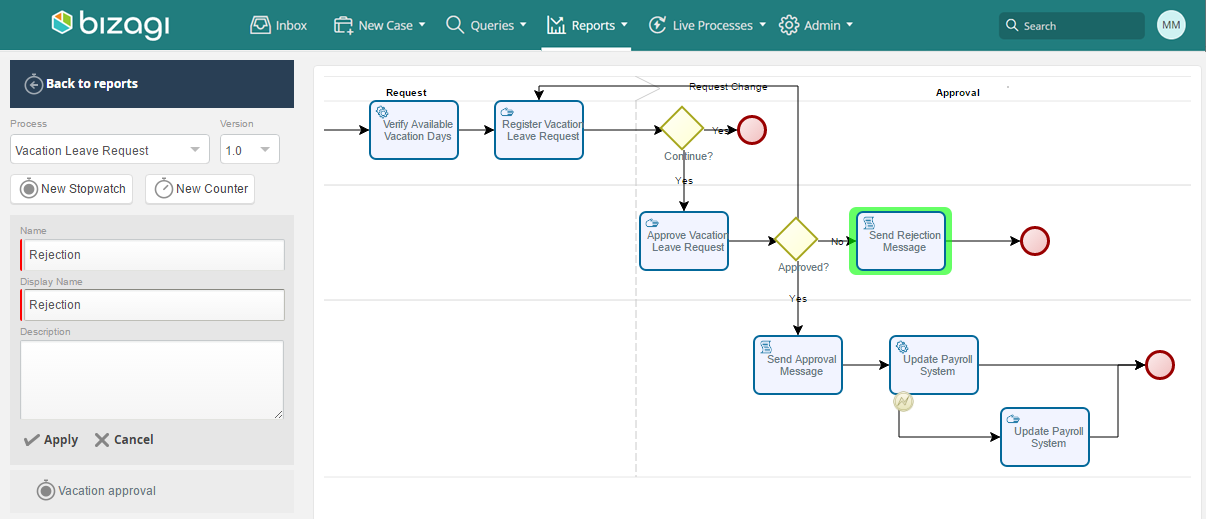
6. Type a Name, Display Name and Description for the Sensor. For Stopwatches include the SLA. Click Apply.
How to Edit and Delete Sensors
1. Go to the Work Portal, select the Report Menu and choose the Sensors option.

2. In the new window click Edit sensors.
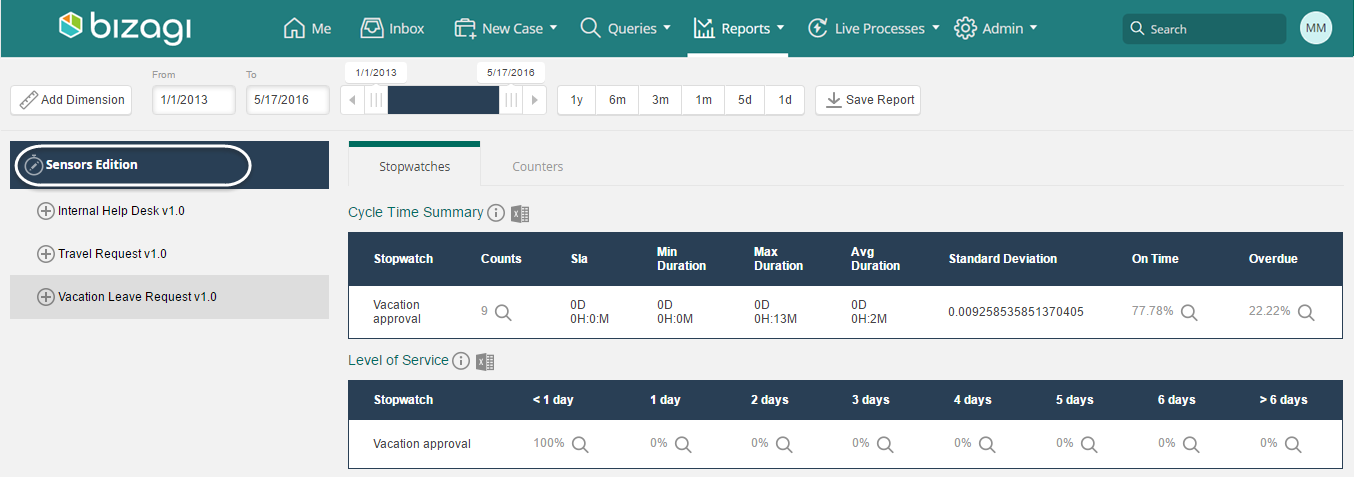
3. On the left select the Process in which the Sensor was created. Select the relevant Sensor and click either the Edit or Delete button as appropriate.
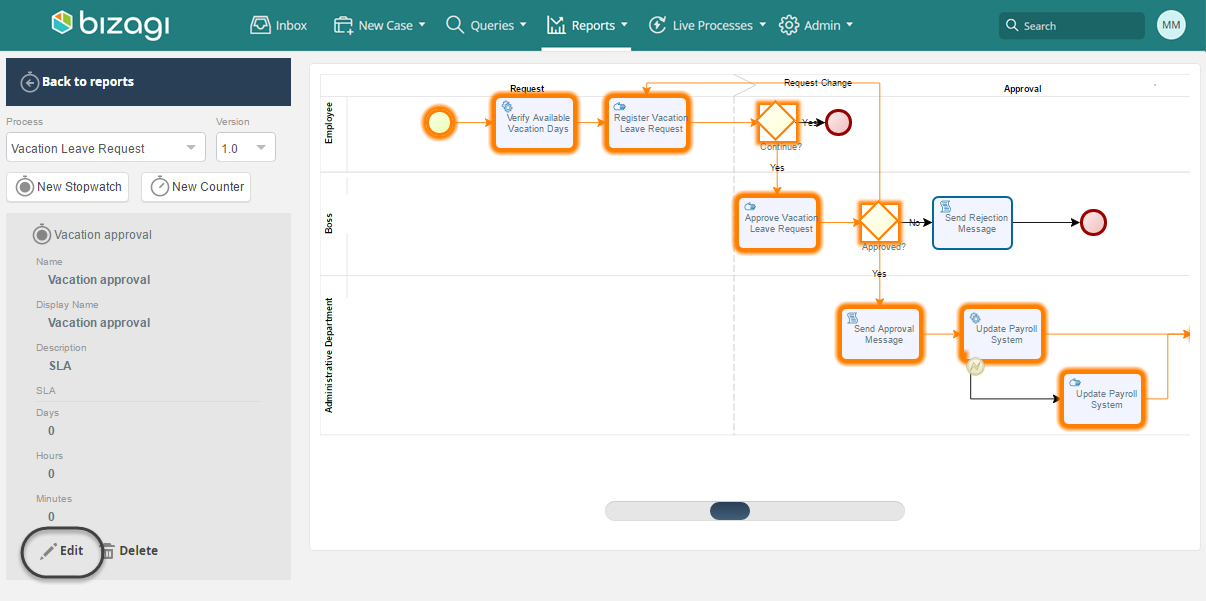
4. For modification, alter the points of the Process where needed and click Apply to save the changes.
Sensors in New Process Versions
When you create a new process version, and you deploy it to test or production environments, existing Sensors of the previous active version are cloned and deployed automatically. If the Activity where the Stopwatch or Counter is associated, does not exist in the new version, the Sensor is not cloned.
If you have multiple versions, Sensors are always cloned from the last active version in the target environment. Additionally, Sensors are cloned considering as follows:
•The Activity related to the sensor must exist in the new deployed version.
•The name of the Activity related to the sensor must be the same in the new deployed version.
Last Updated 4/5/2023 5:37:19 PM