The Business Activity Monitoring is an analysis tool that allows you to graphically view information about the status of ongoing cases.
IMPORTANT: This feature is only enabled when the Processes and Task Duration are configured. This way Bizagi can establish a comparison between expected and real time execution.
Business Activity Monitoring is comprised of three reports:
•Process BAM: analyze the current state of all ongoing Processes.
•Activity BAM: analyze the current state of ongoing Activities.
•Resources Monitor: analyze the current workload and performance of end users and work teams.
|
The real execution time of a Process or Activity is calculated based on the Standard Working time schema, regardless the existence of other time schemas. |
This report allows you to analyze the current state of all ongoing Processes. The report describes two types of analysis:
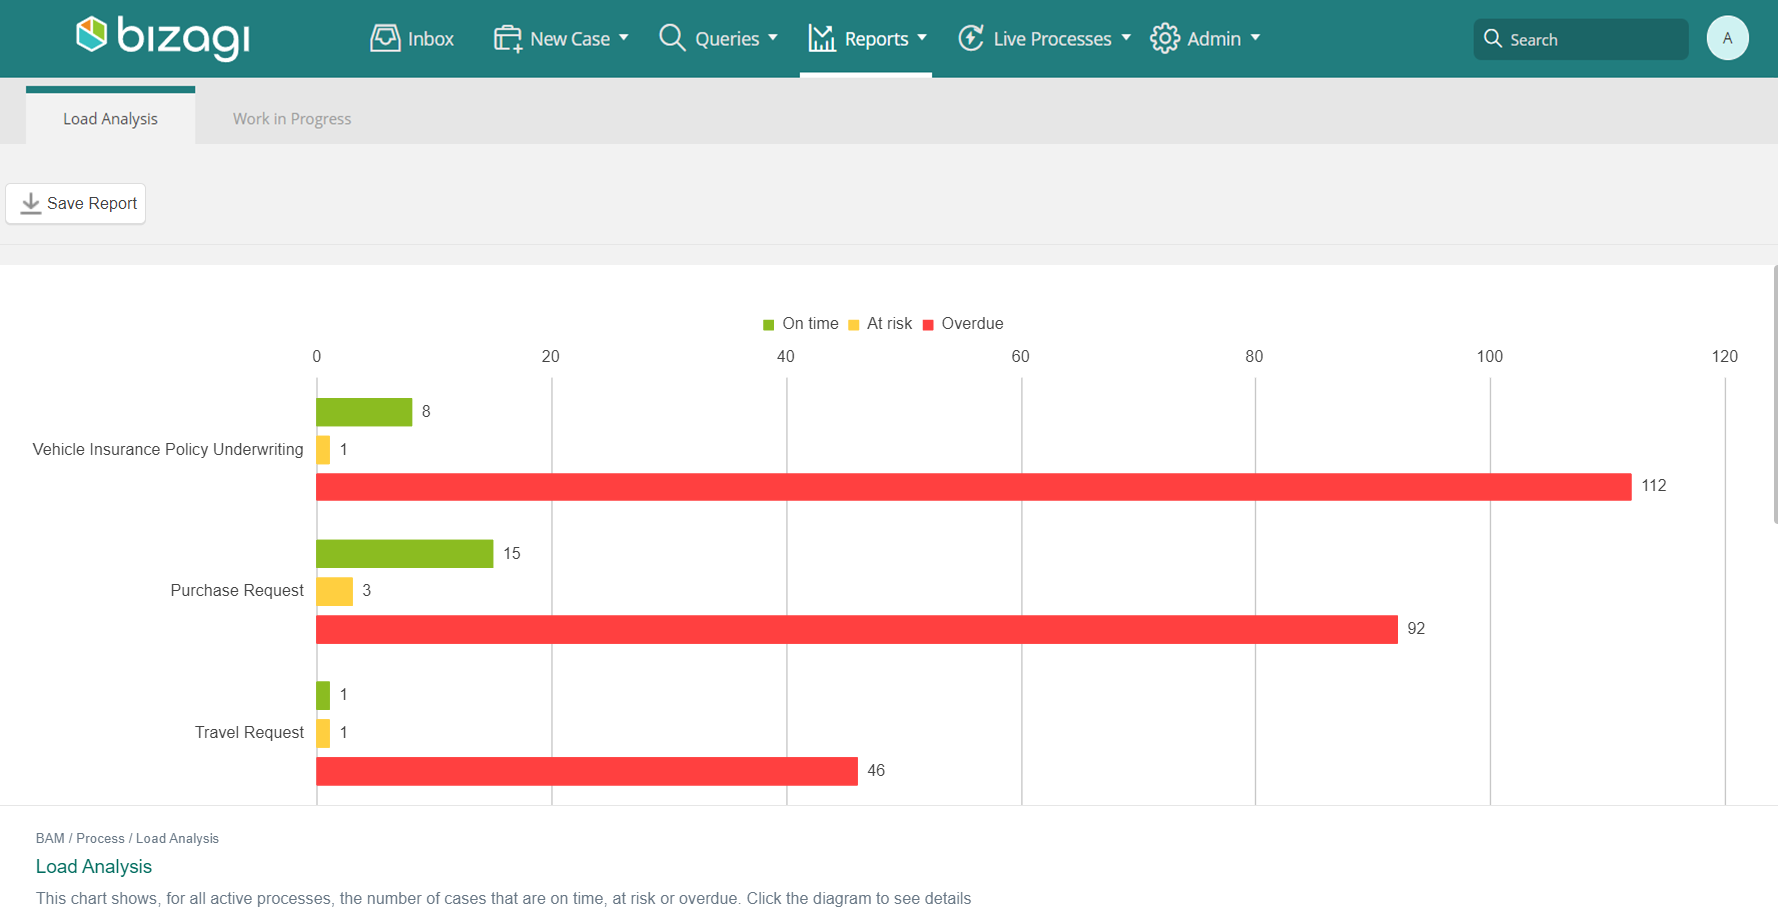
•Load Analysis: This chart displays a histogram with the number of ongoing cases that are on time, at risk and overdue, for each Process. The graph is presented in colors to identify each Process status. The information used to display the charts is obtained from the latest version of the selected Process.
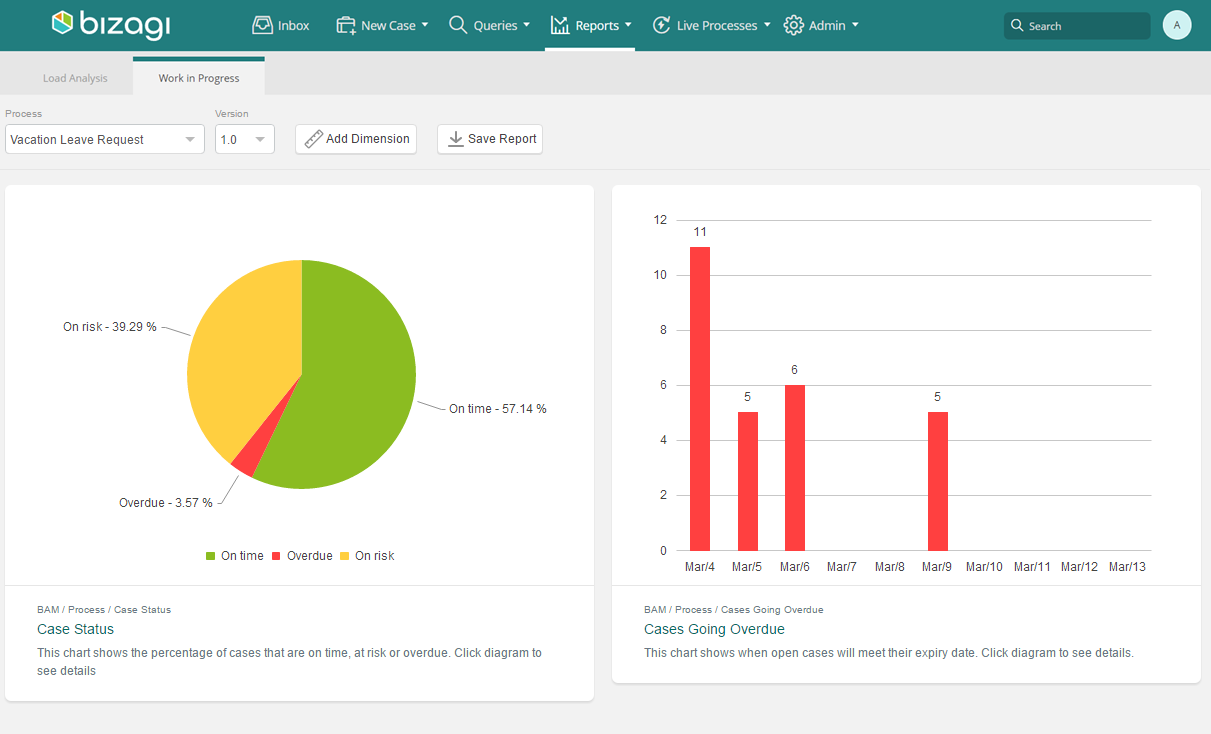
•Work in progress: A pie-chart shows the percentage of cases that are on time, at risk and overdue. The bar chart on the right shows when open cases will meet their expiry date. The horizontal axis depicts the next ten days and the vertical axis shows the number of cases that will expire in each of them. Cases can be filtered by Process or any of the Dimensions defined.
This report allows you to analyze the current state of ongoing Activities. It covers two types of analysis:
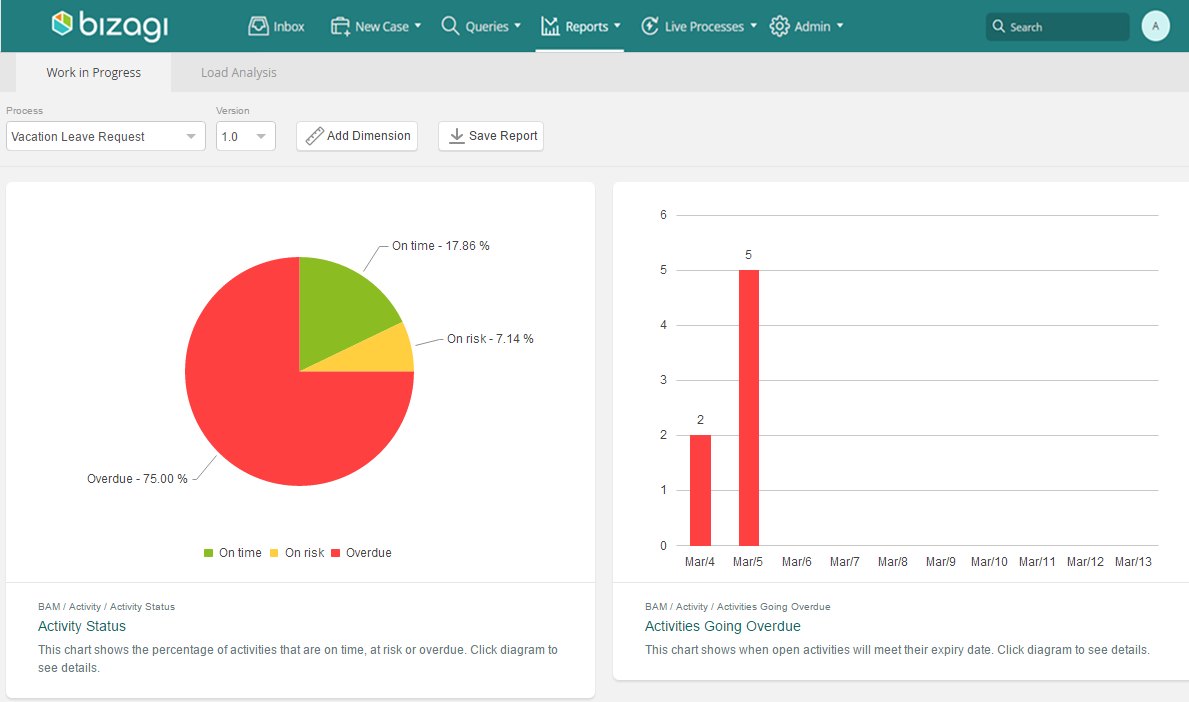
•Work in progress: A pie-chart shows the percentage of Activities for a given Process that are on time, at risk and overdue. Cases can be filtered by Process or any of the Dimensions defined. A bar chart on the right shows when open Activities will meet their expiry date. The horizontal axis depicts the next ten days and the vertical one shows the number of cases that will expire in each of them.
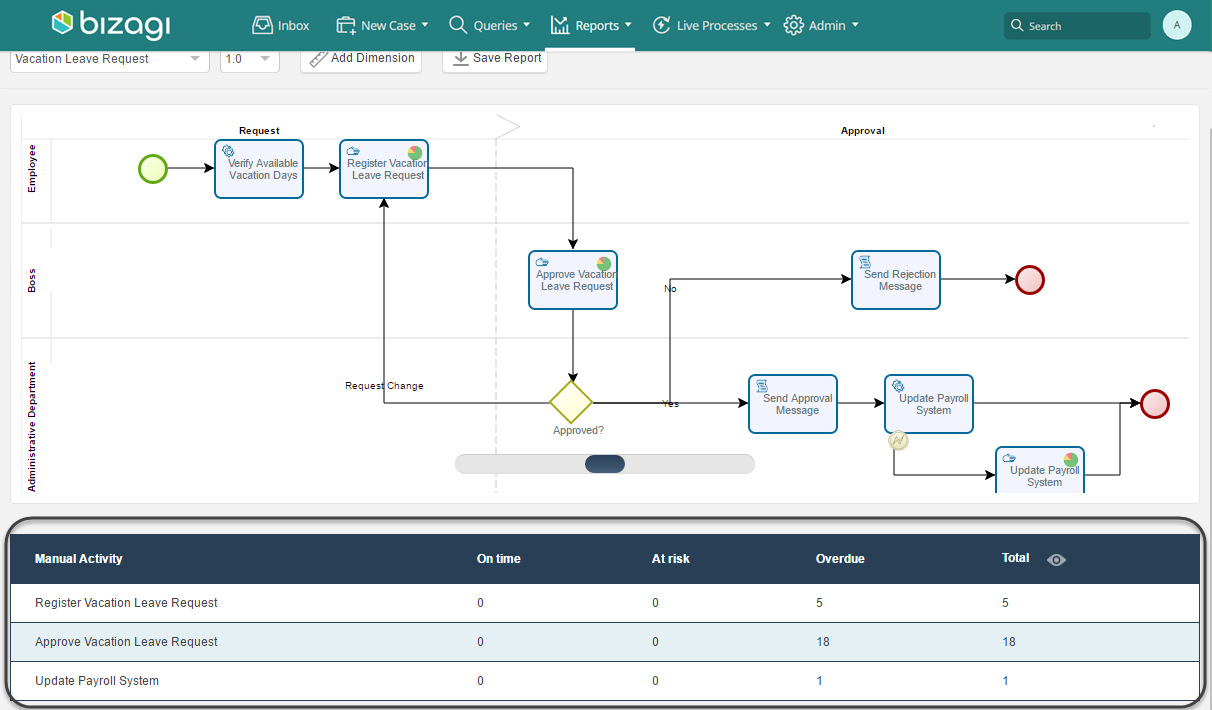
•Load Analysis: Each Activity performed by an end user has a summary, hidden by default. This summary shows the number of cases that are on time, at risk and overdue. To display the summary, hover the mouse pointer over a Activity.
Click the magnifying glass icons to open the list of associated cases.
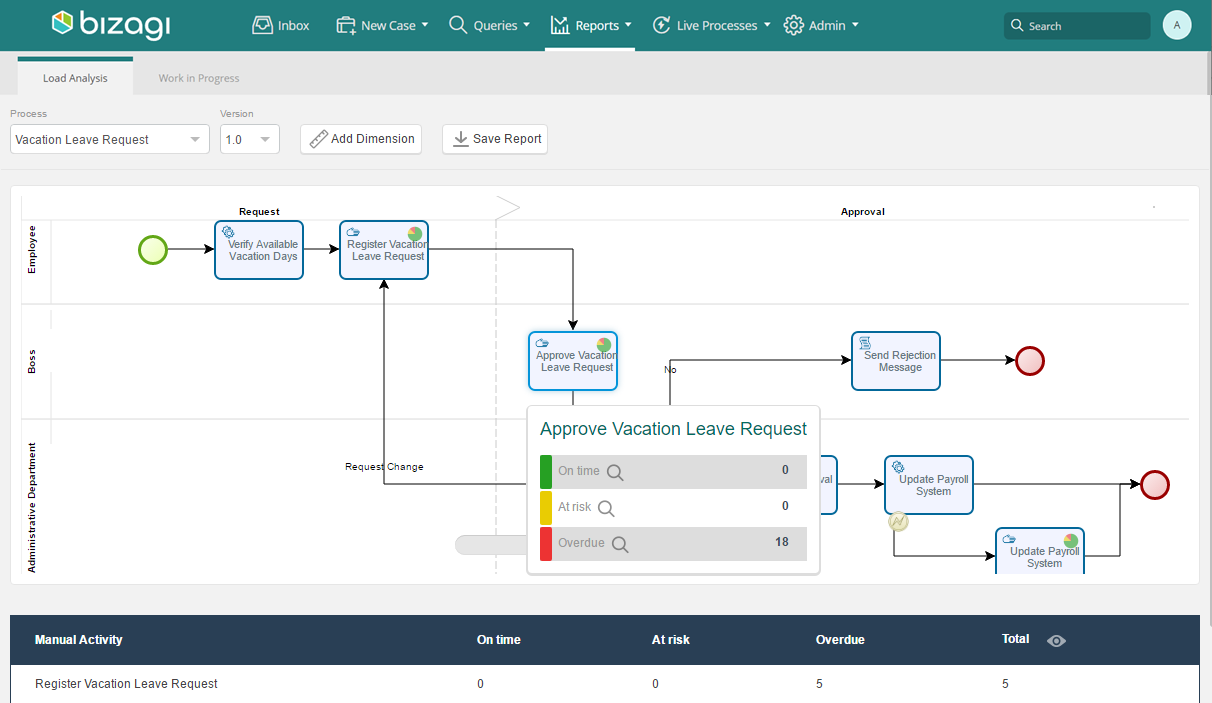
Each diagram contains an Activity table at the bottom. For each manual Activity, the list indicates the number of cases on time, at risk and overdue.
This report allows you to analyze the current workload and performance of end users and work teams. The report describes three types of analysis:
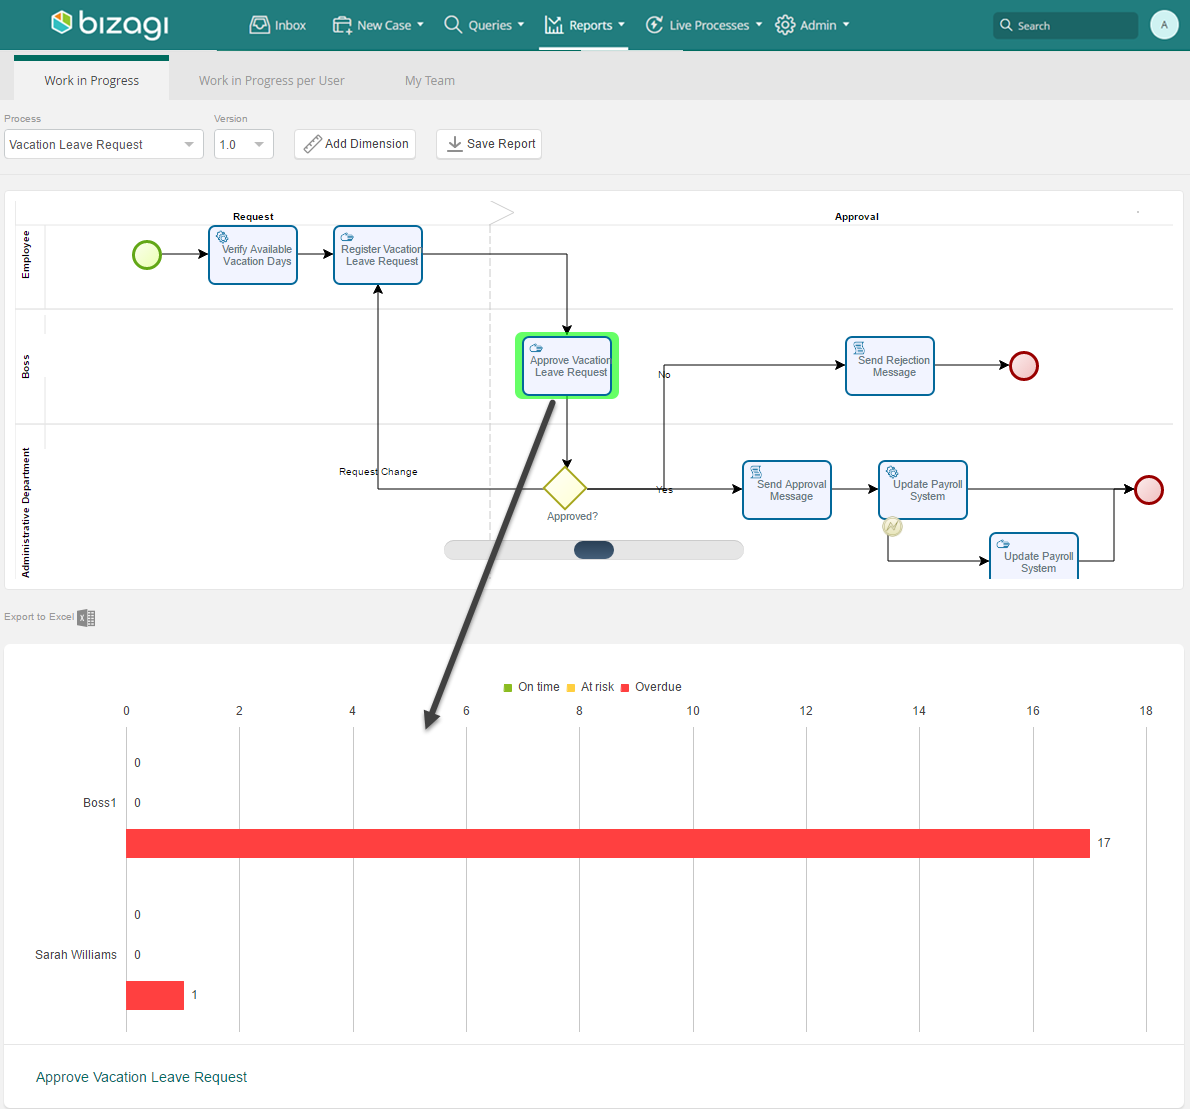
•Work in progress: For each outgoing Activity of a Process, the report graphically presents the allocated users and the status of their pending activities.
The bar graph colors and count the cases assigned to each user, indicating whether they are on time, at risk or overdue.
You can analyze a specific Activity by selecting it in the Process Diagram.
If no Activity has been selected, the report will display all opened Activities with their assignees.
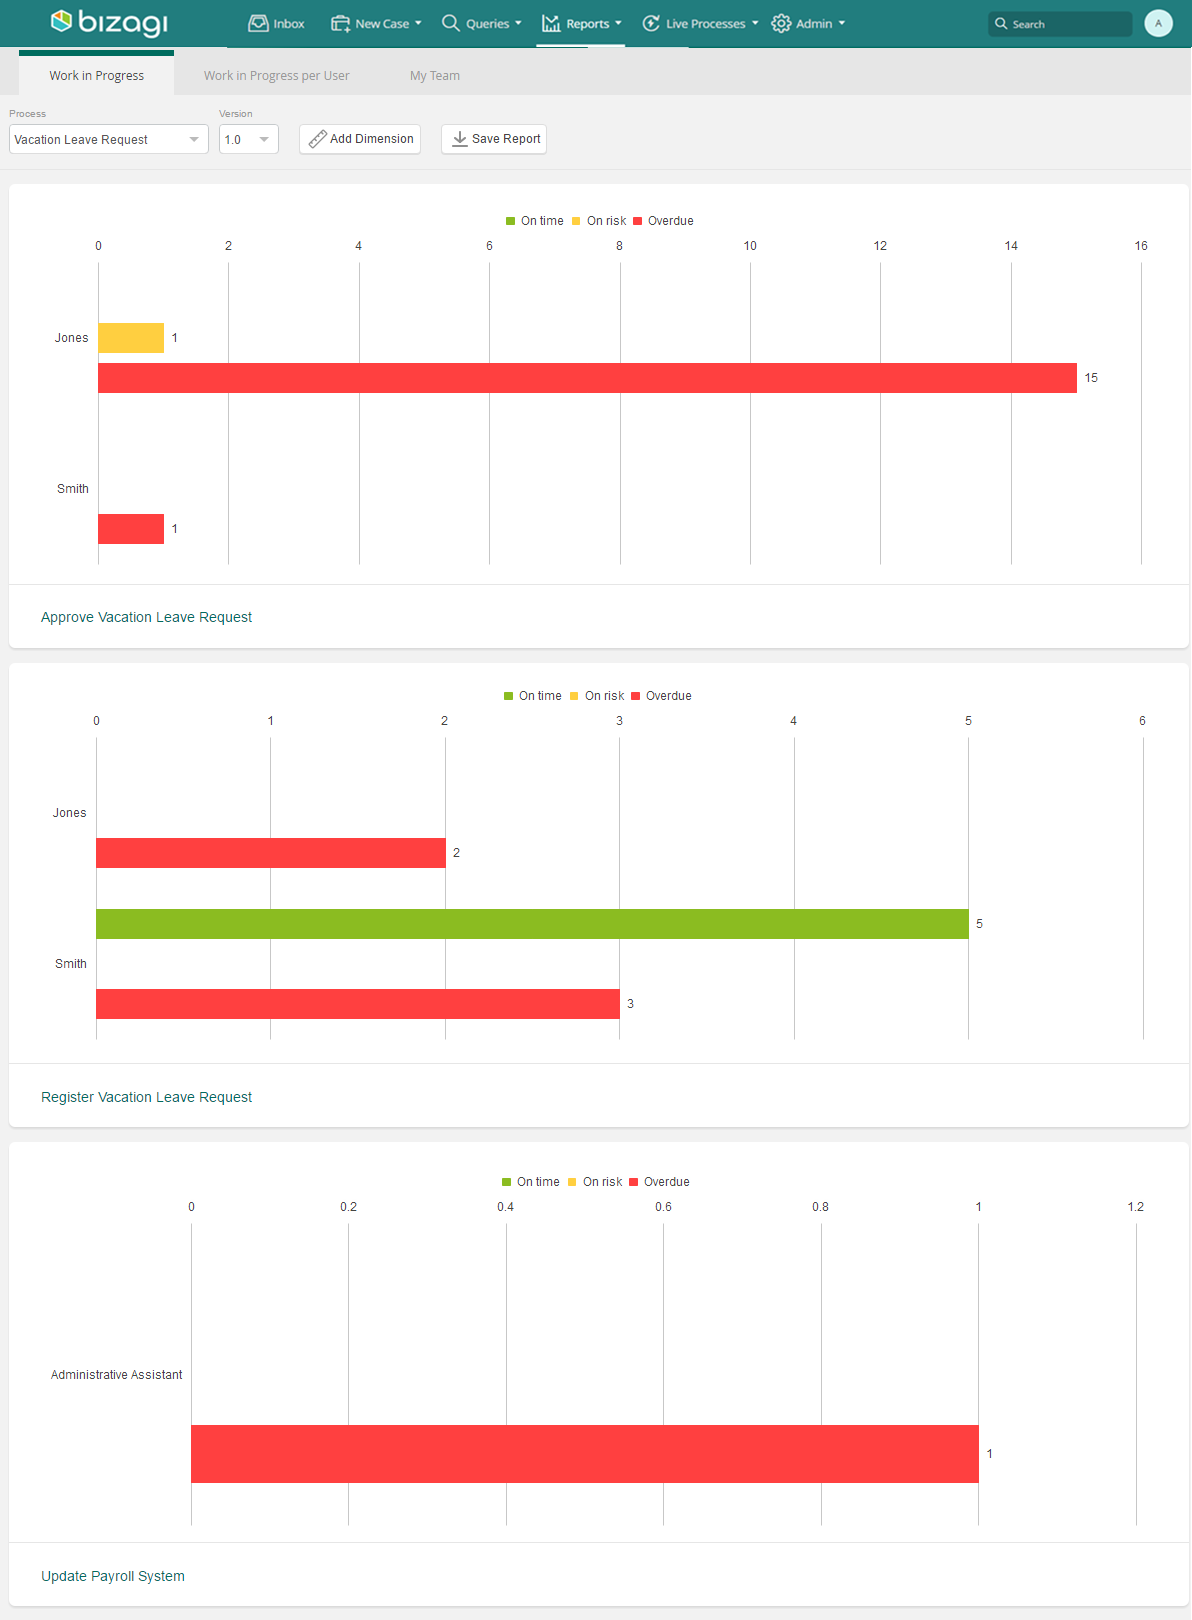
You can filter this report by any user Dimension to only display the cases of the assignees that meet the condition.
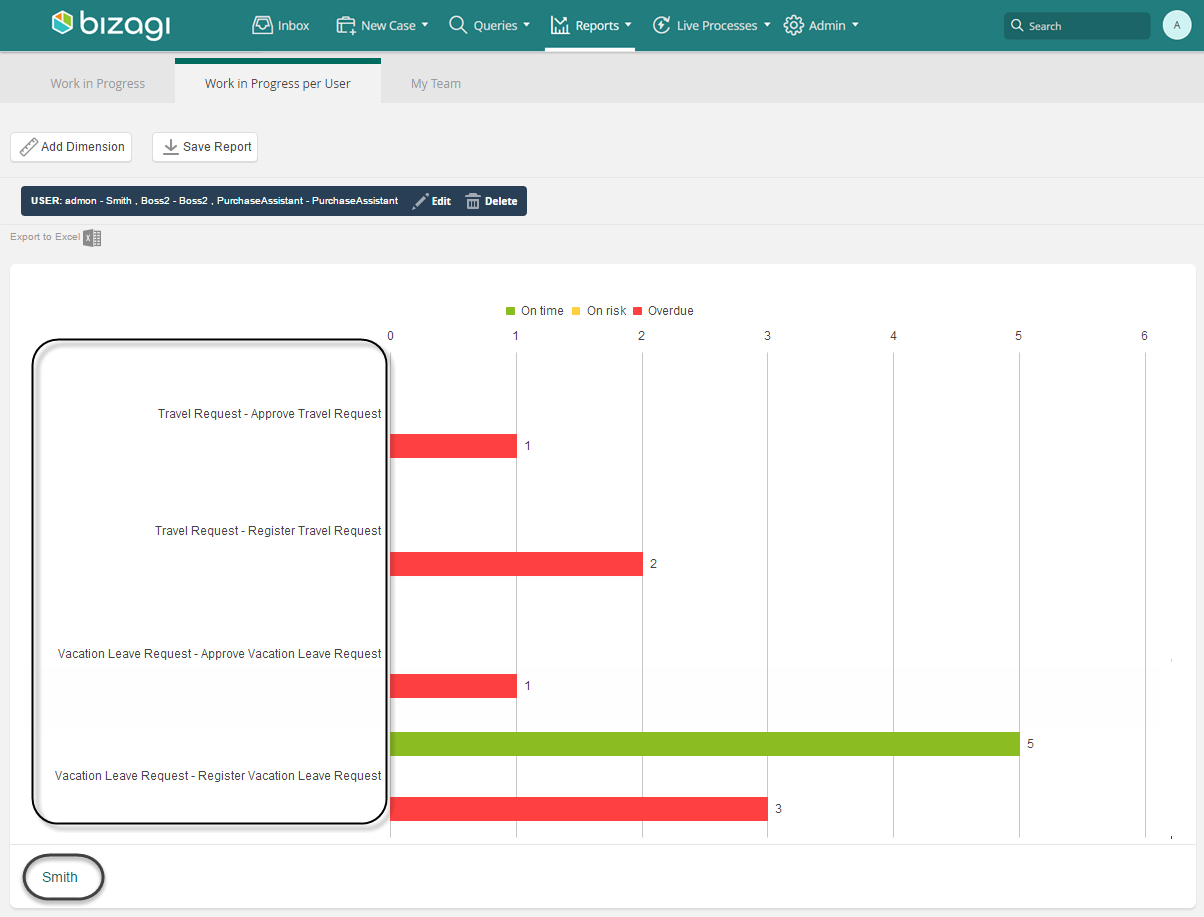
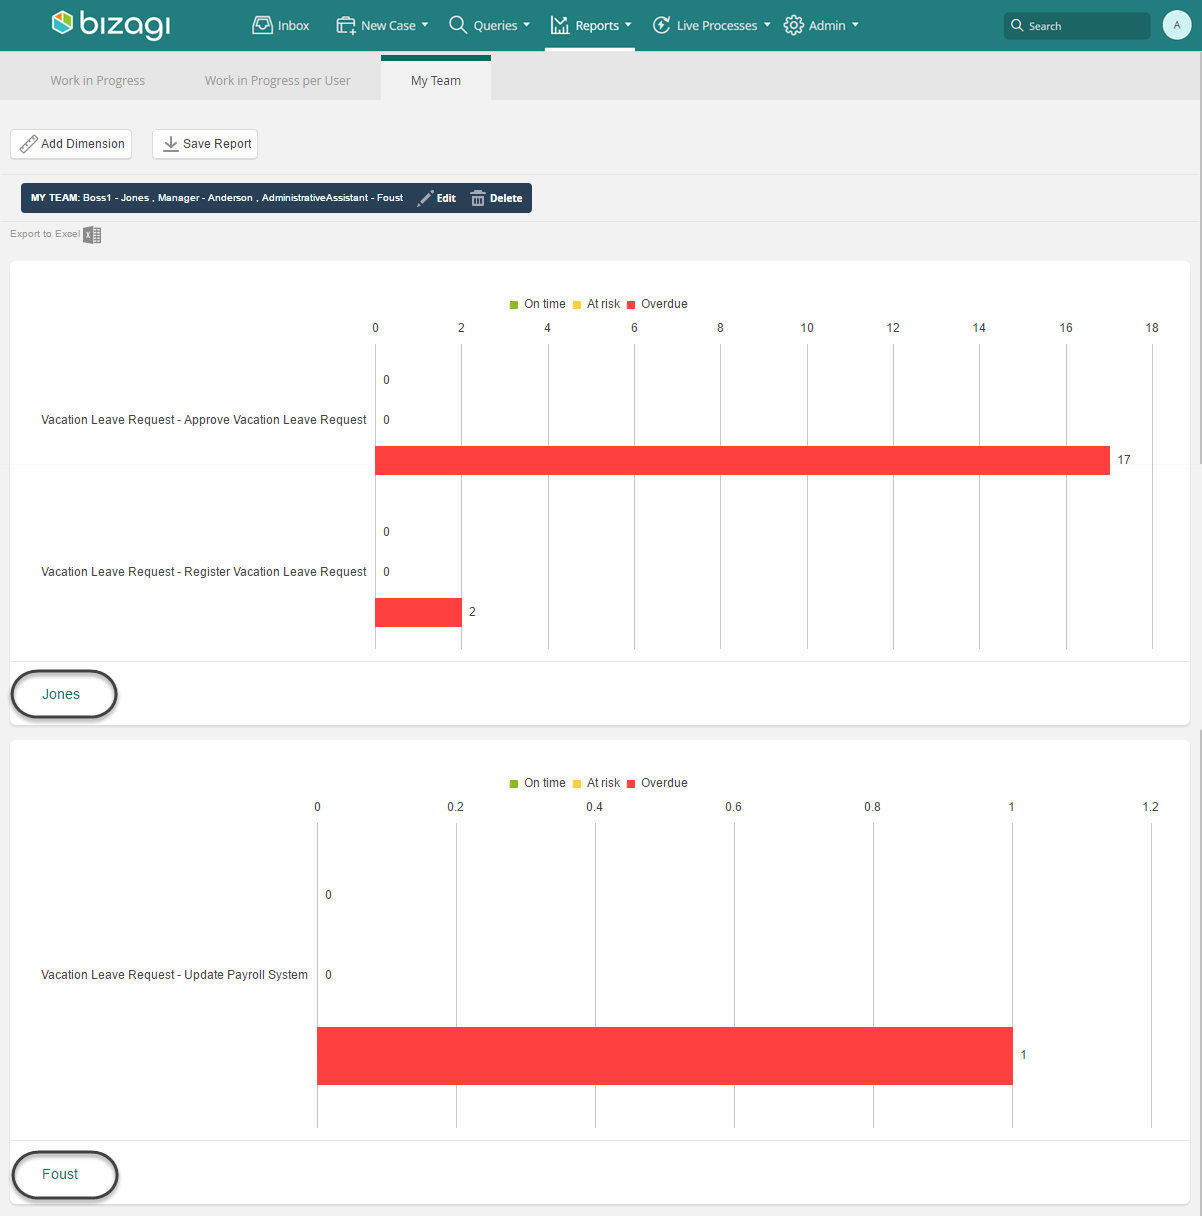
•Work in progress per User: This report graphically presents the status of ongoing cases exclusively for the users that meet the conditions specified in the Dimensions. If no Dimensions have been assigned, the report will be blank. At least one Dimension must be selected to display information. The system presents a separate report for each user. The graph colors and counts the ongoing Cases for each Process Activity assigned to the filtered user.
•My Team: This report is designed specifically to analyze your team's performance, that is, the people that report directly to you. The Report is pre-filtered by the relevant Dimensions to show only your subordinates. Consequently, this report will only display if you are assigned as a team leader (i.e. have subordinates).
The system displays a separate report for each team member. The graph colors and count the number of pending Cases according to their status, identifying the Process and Activity.
Case Details
Click any of the report charts mentioned above to display a list of all the cases relating to that part.
This list can be exported to Excel by clicking the link found at the bottom left of the screen.
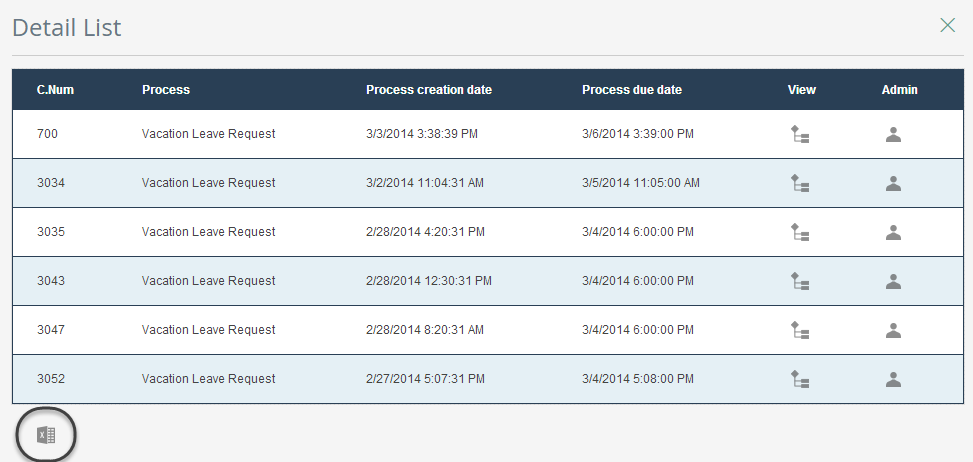
1. Click the Case number to access a specific case.

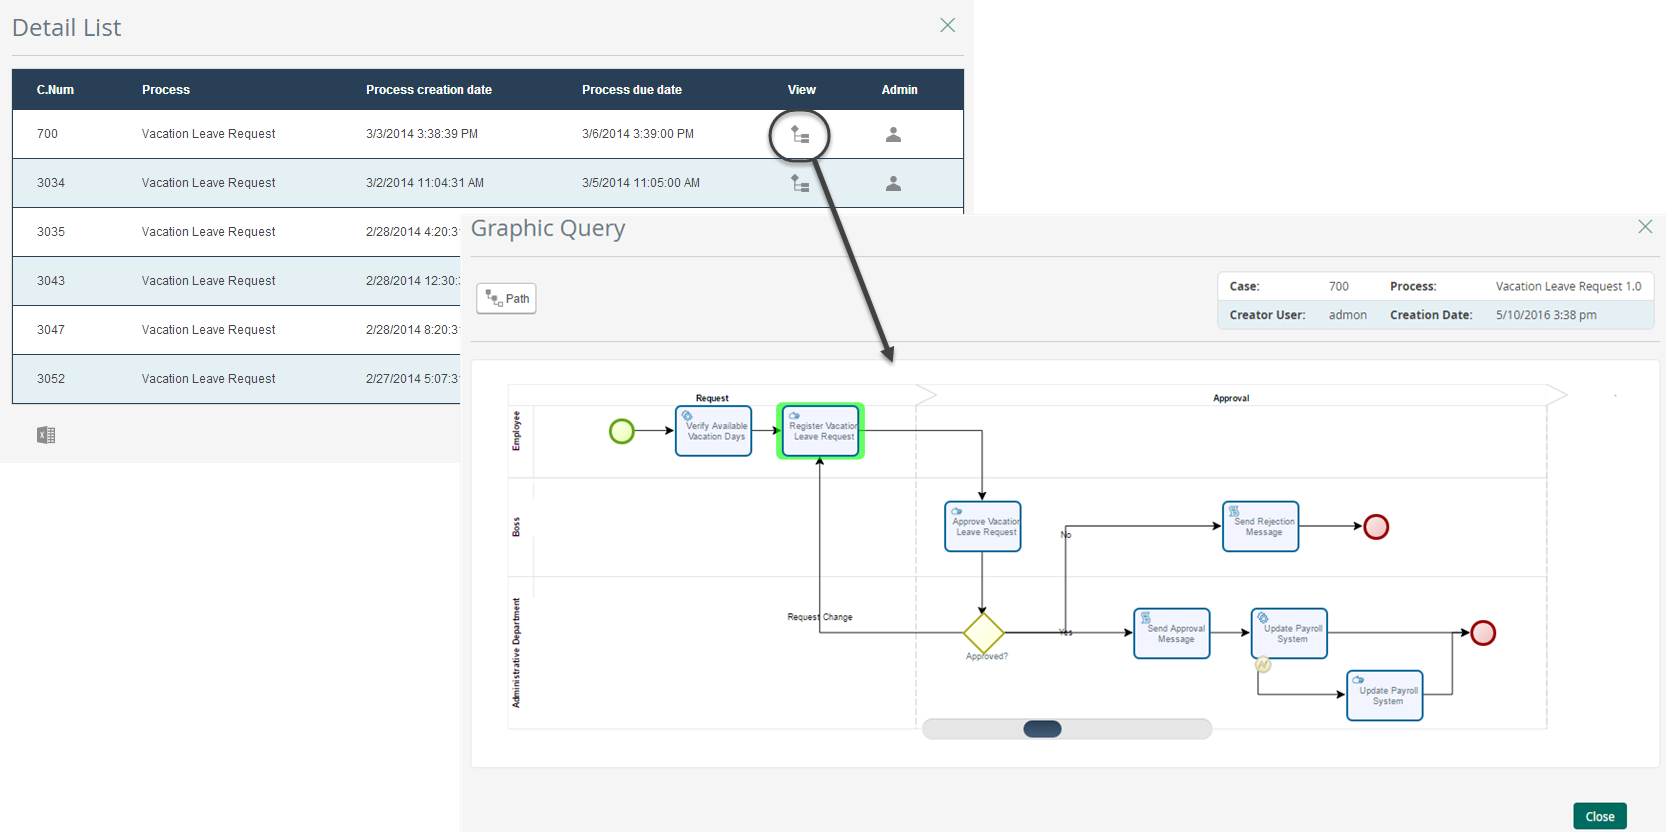
2. Click View to see the state of the case within the Process and its path.
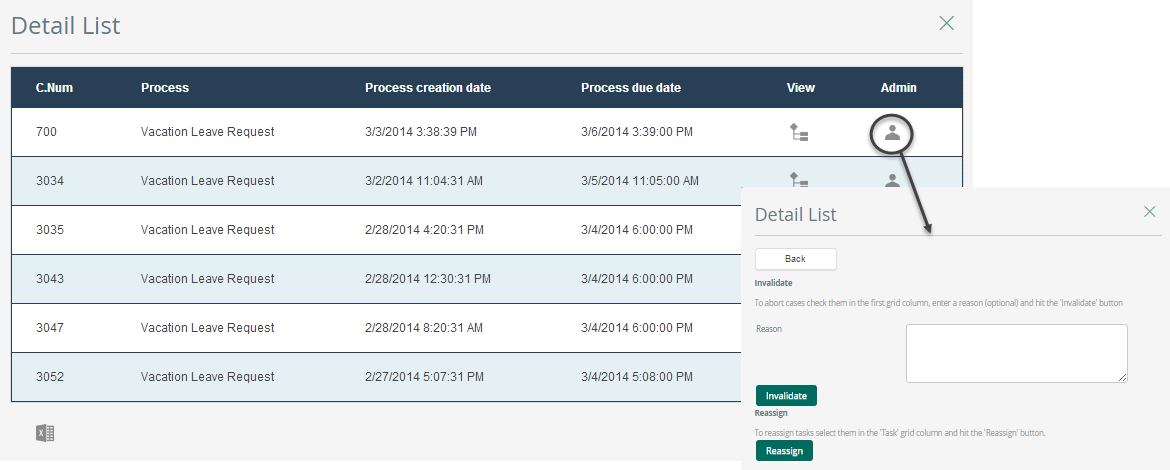
3. Click Admin to access the Case's administration page to reassign it or abort it.
4. For the Activity BAM menu, when the list of cases is displayed, a column with the listed Assignees is available.

|
With Ask Ada's Open Cases Monitoring feature you can run queries, view open cases, and reassign them within your direct team (first level of reporting) in real time. Using natural language, you can check the status of open cases and processes, bringing open case information from the BAM (Business Activity Monitoring) capabilities from the Work Portal into the Ask Ada experience. |
Last Updated 11/19/2025 4:33:41 PM