Overview
Bizagi Ltd offers a Widget Editor service that allows you to create your own Widgets in an assisted manner.
This same Widget Editor allows you to modify existing Widgets and produce a new one that adjusts to specific requirements.
For more information about Widgets and what you need to create or modify them, refer to Creating Widgets.
Through the example illustrated below and the guided steps, you will produce a new Widget by performing modifications to an existing one.
For a better understanding of the steps carried out below, it is recommended that you are already familiar with Widgets and their structure.
Example
In this example, we will create an Area Chart Widget parting from the Line Chart Widget as available at the Widget Xchange.
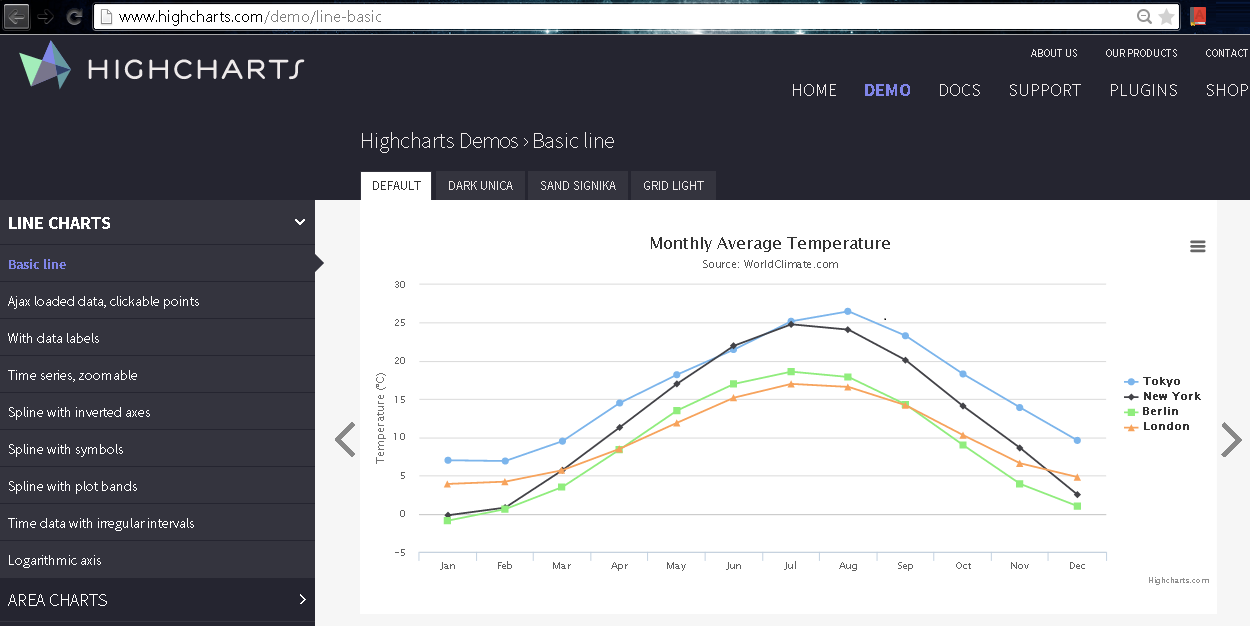
The current Line Chart Widget is useful to present a series of data in a line chart, by relying on the HighCharts library, and as shown at highcharts.com:
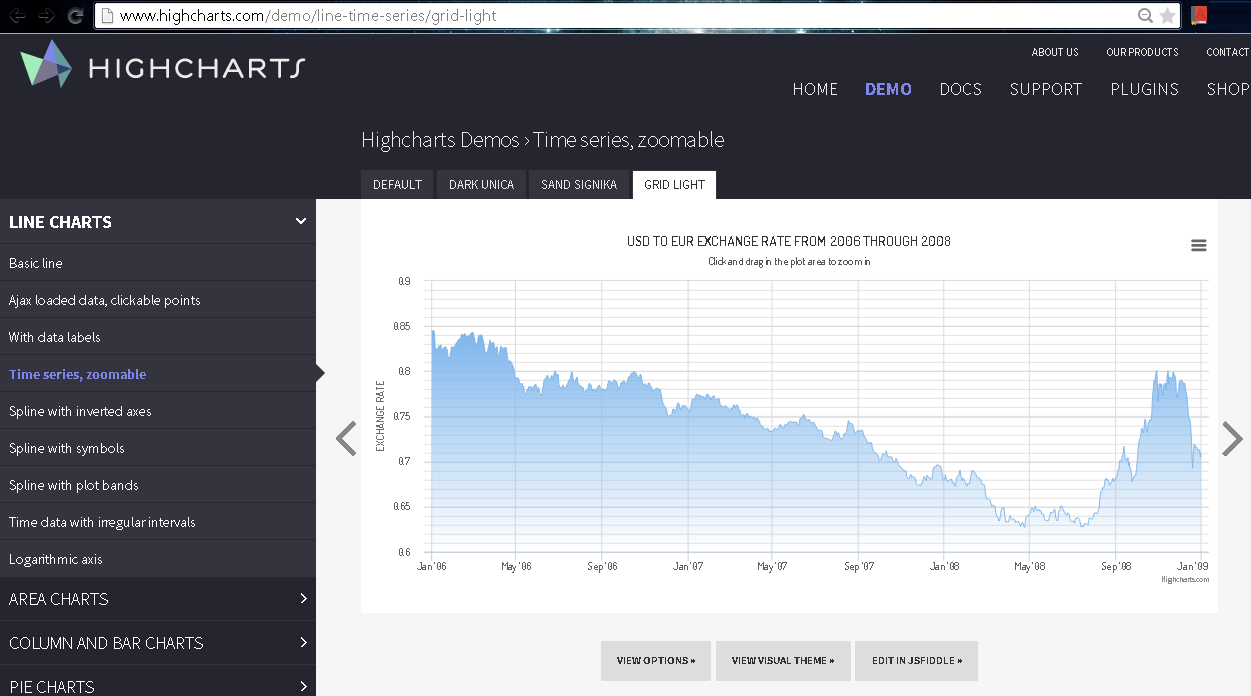
The Area Chart Widget we want to create parts from the existing implementation and it is also provided by the HighCharts library, and shown at highcharts.com:
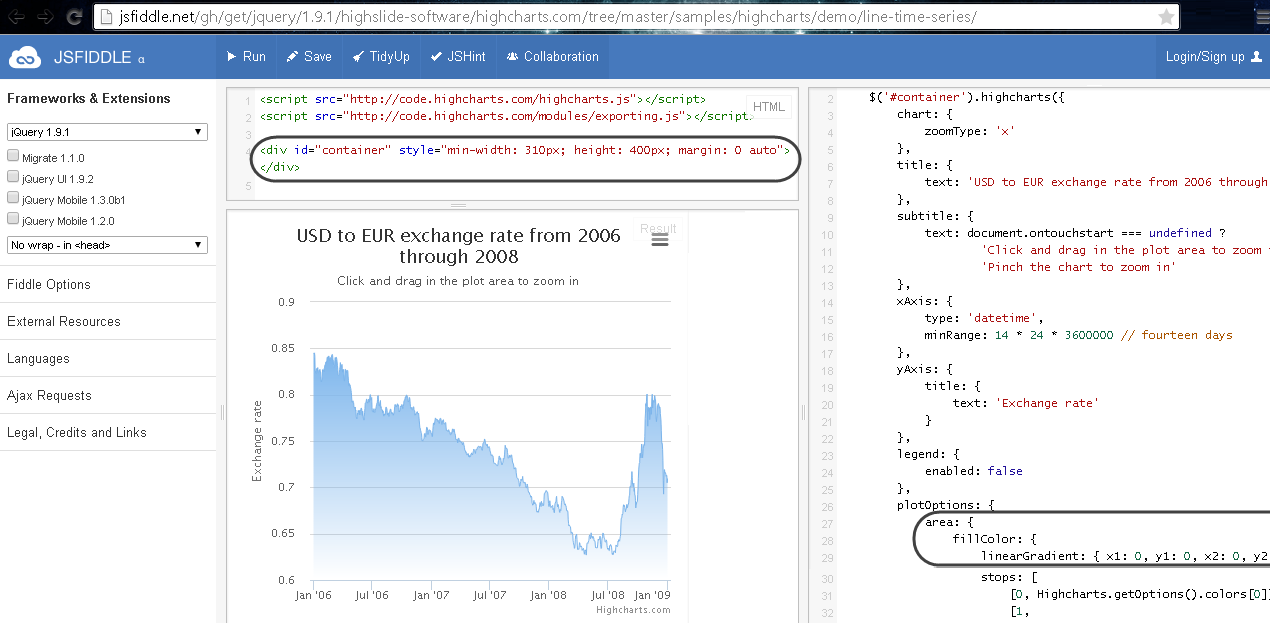
In order to create an Area-chart display, we will need to make small adjustments because as seen in the online chart demo, the library and overall structure of the Widget will remain similar while specific parameters for this type of chart will change:
Most adjustments to the Widget will be focused on:
•Renaming the Widget in its display names, and internal files.
•Modifying the parameters used to display the chart to change the actual implementation.
•Changing the icon.png used as the preview thumbnail when using the Widget in the Forms Designer.
•Additional modifications in order to simulate the Widget, and to propagate these changes for the tablet and smartphone implementation.
Hands on!
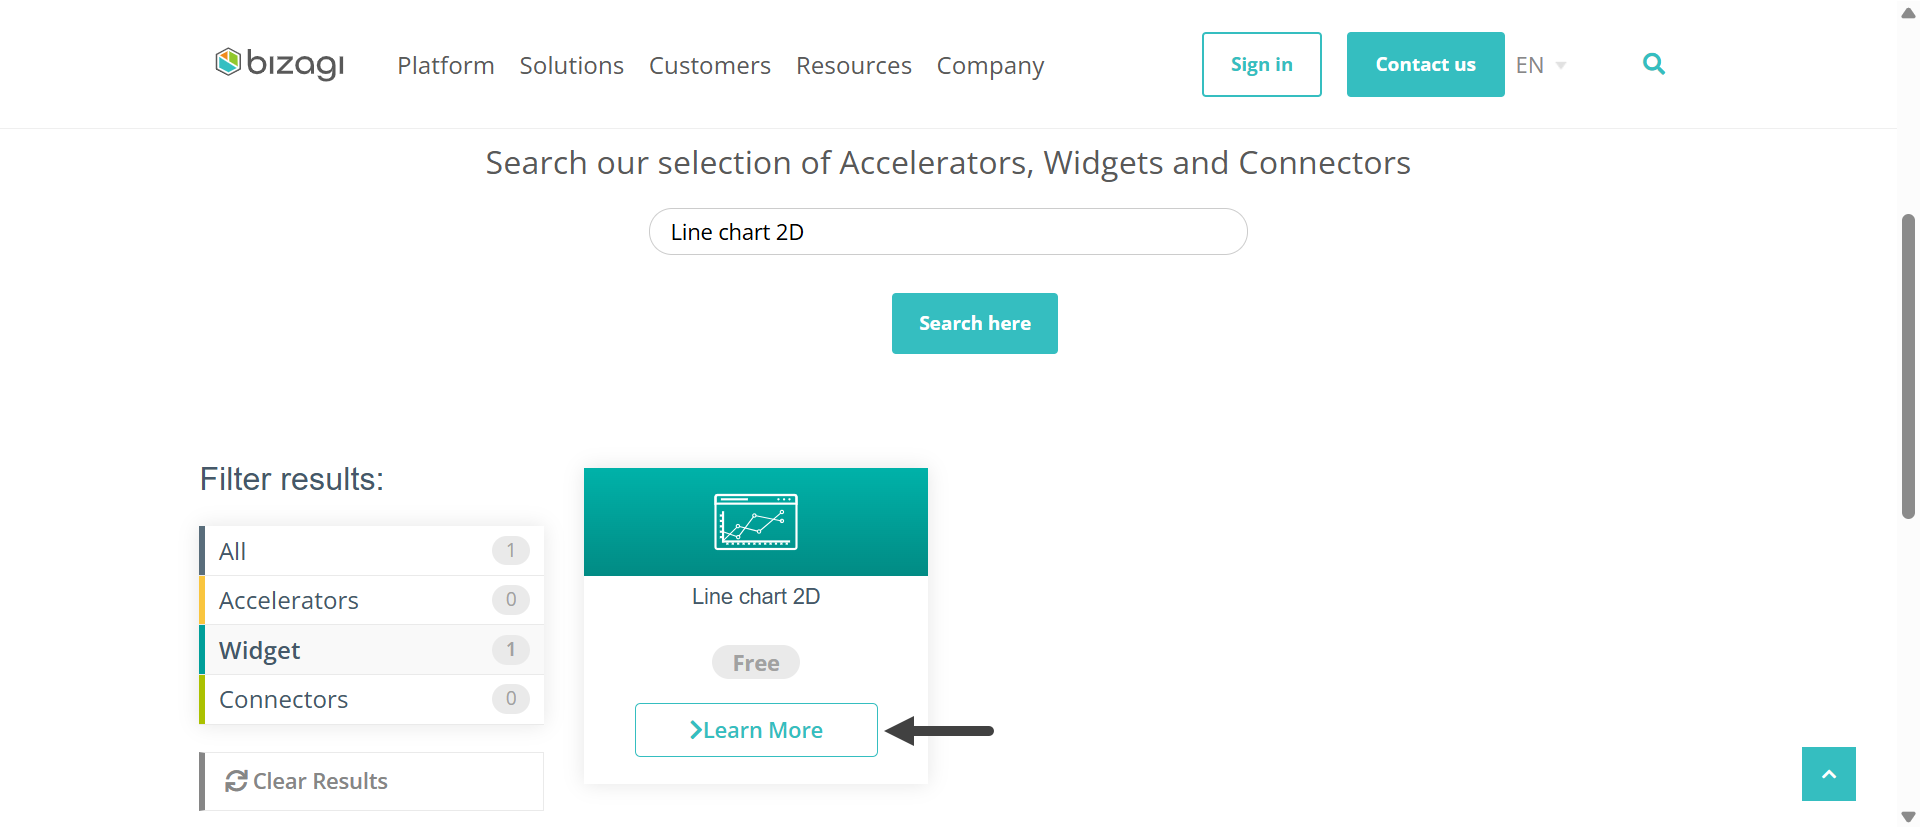
Access the Bizagi Xchange Marketplace and search for the Line Chart 2D widget, then click Learn More on its card.
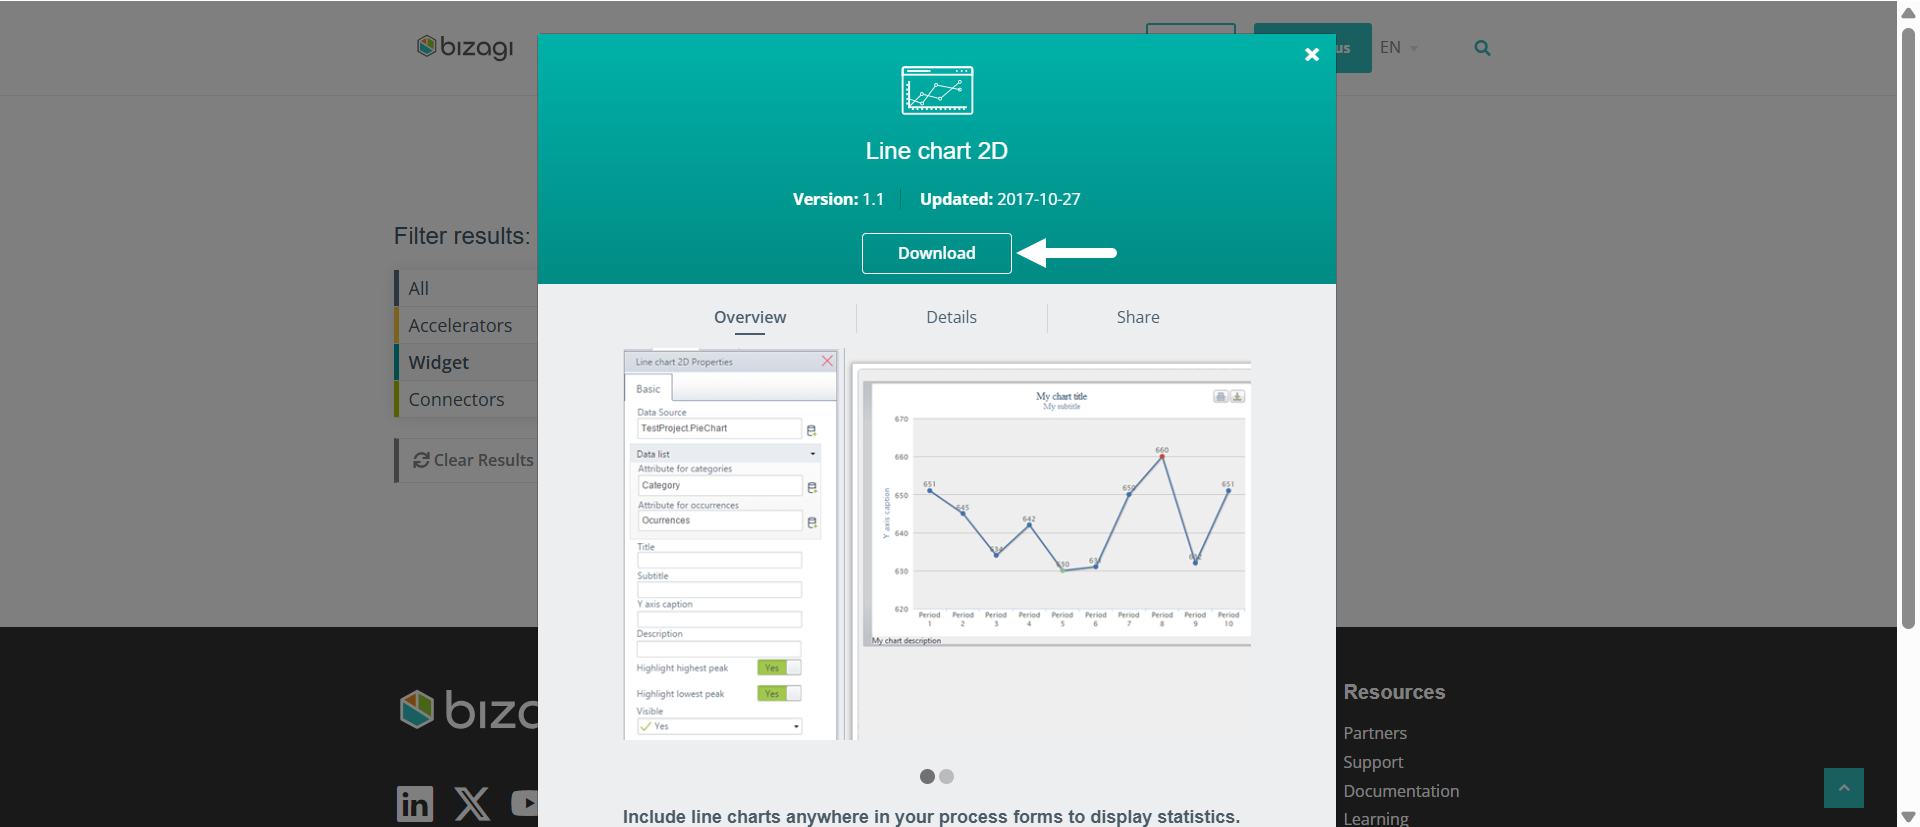
Click Download and save the widget to your preferred location.
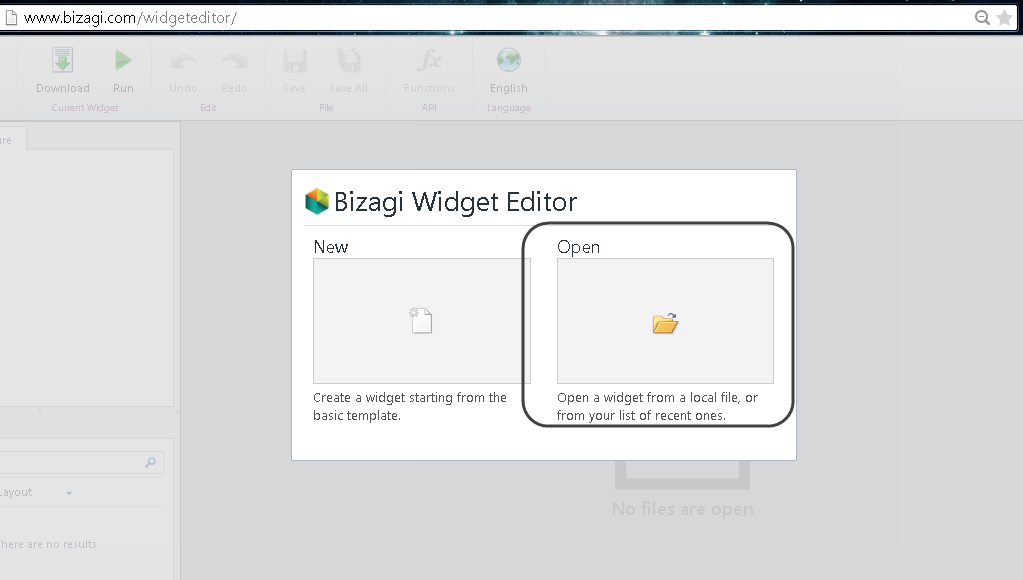
Next, open the Widget Editor and log in with your bizagi.com account.
Once there, follow these steps:
1. Use the Open Widget option to load the downloaded LineChart2D Widget:
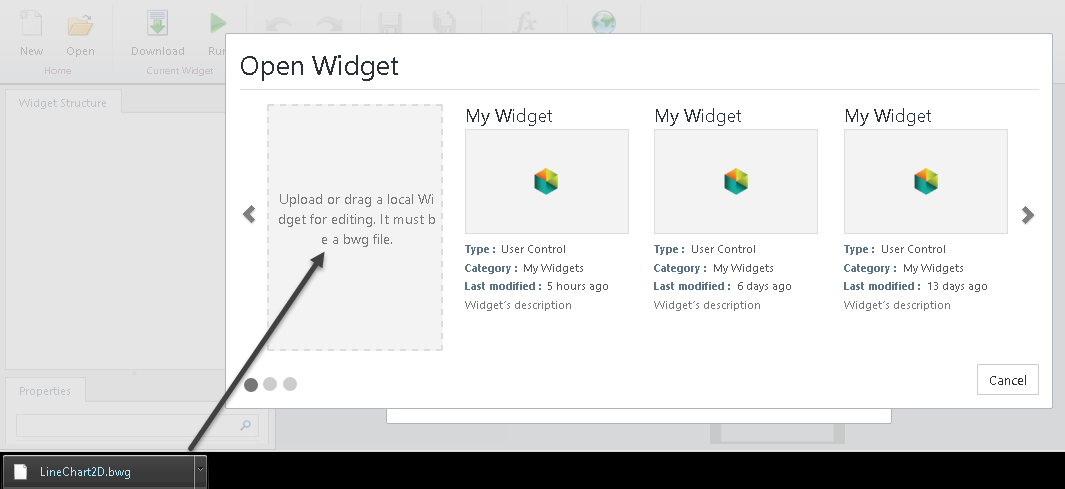
2. Drag and drop the LineChart2D Widget's .bwg file into the Open options:
|
Upon this action, the Widget will load with its file structure and properties. When loading the Widget, an auto-generated GUID will be used to replace the one of the original .bwg file, and therefore, it won't be necessary to modify or meddle with GUIDS. |
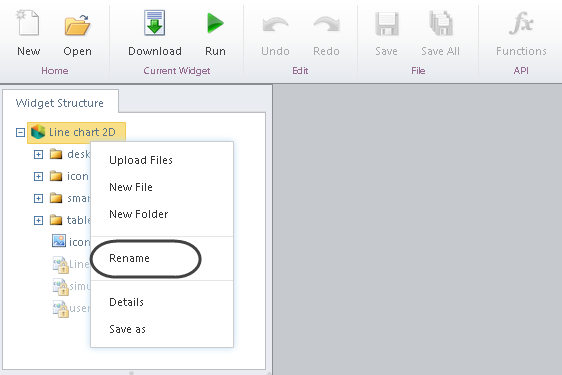
3. Change the name of the Widget in its internal properties.
•To do this, first right-click the Widget main's folder, and use the rename option (for instance, name it as Area Chart 2D):
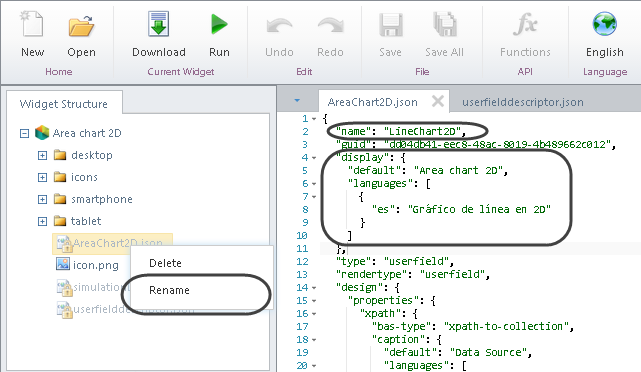
•Rename the properties definition file (.JSON) as well, and make sure you edit display names and localization labels inside of it (we are basically replacing Line occurrences for the word Area):
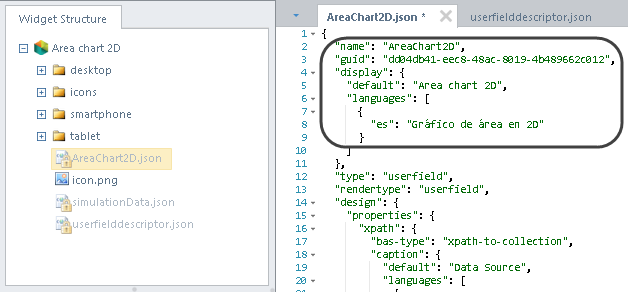
The modified content should look like this:
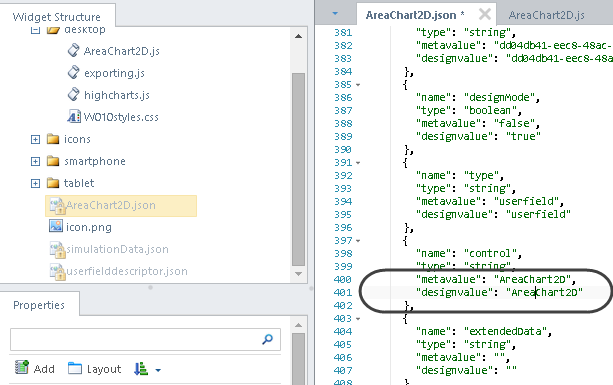
Still in the same file, edit the metavalue and designvalue of the Widget for runtime purposes.
This is done by specifying AreaChart2D too for the control property:
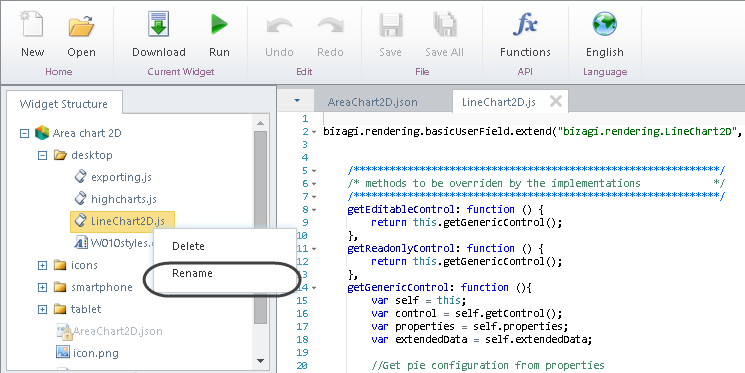
•Similarly, rename the implementation file and other files accordingly to use the same AreaChart2D name
We may do this initially for the desktop implementation file, and leave for later, replacing the implementation files for tablets and smartphones so that we can actually replace the whole file (an easier way to do this):
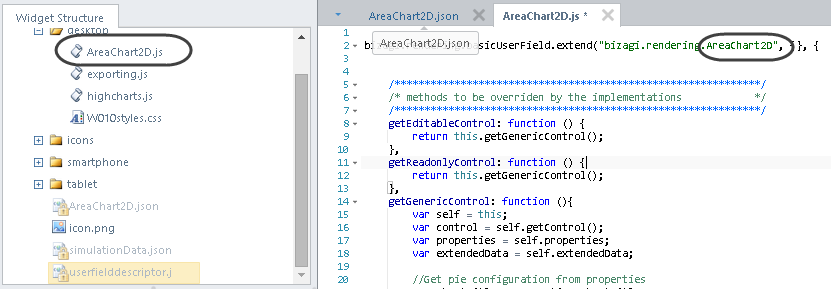
•After renaming the file, make sure you also consider the definition at the very first line of the content of that implementation file, so that it uses AreaChart2D instead (otherwise the Widget will not run):
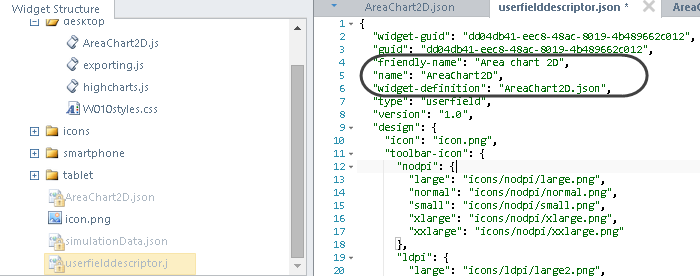
After having edited these files, open the userfielddescriptor.json file to edit display names and similar labels as well:
4. Edit the implementation code to adjust a line chart to an area chart.
As a best practice, start off by editing the implementation for the desktop devices (by editing the desktop\AreaChart2D.js file).
Once you are sure it is working as expected, changes will be propagated to the other devices.
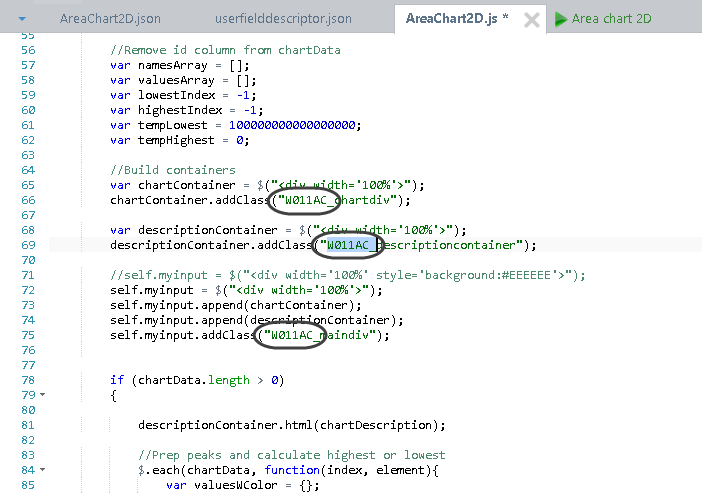
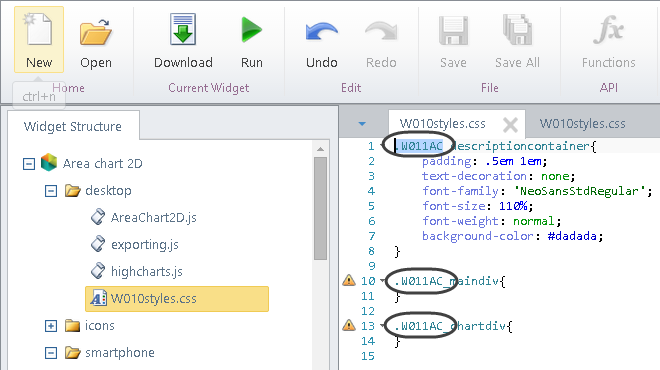
To edit the code, first notice that we don't strictly need changes in the main functions that display the Widget, though it is a good practice to change the name of the CSS classes involved by your Widget so that you can rely on settings to customize its appearance and avoid conflicts with the original Line Chart Widget.
•Replace the W010LC part for another sub-string, for example: W011AC.
•Then, locate the plotLines function which has the logic behind to display the chart by relying on the Highcharts library.
Notice that these parameters need to be set accordingly to what shown in the fiddle page:
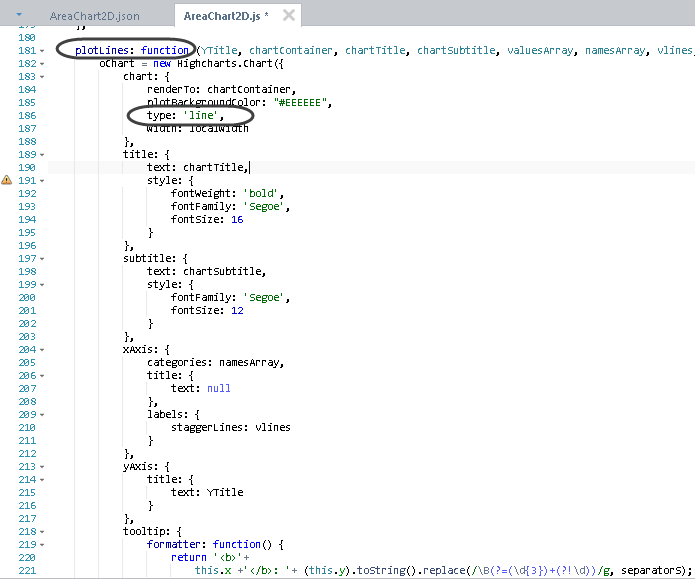
A line chart will no longer be used, and these parameters will be used instead:
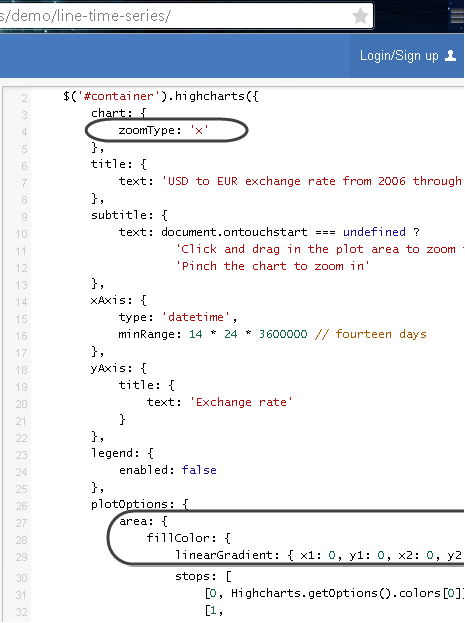
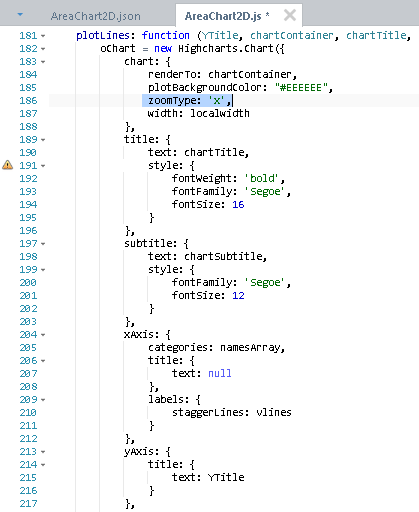
•Make these above changes accordingly (to include the zoomType, remove the line-type of chart, and handle other parameters):
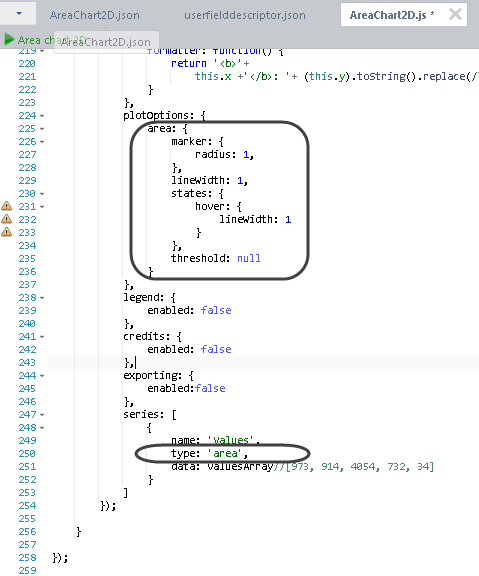
Most importantly, the plotOptions defining area as a parameter as well as the series data:
|
The modified plotLines function should be set having this code:
plotLines: function (YTitle, chartContainer, chartTitle, chartSubtitle, valuesArray, namesArray, vlines, separatorS, localwidth){ oChart = new Highcharts.Chart({ chart: { renderTo: chartContainer, plotBackgroundColor: "#EEEEEE", width: localwidth, zoomType: 'x' }, title: { text: chartTitle, style: { fontWeight: 'bold', fontFamily: 'Segoe', fontSize: 16 } }, subtitle: { text: chartSubtitle, style: { fontFamily: 'Segoe', fontSize: 12 } }, xAxis: { categories: namesArray, title: { text: null }, labels: { staggerLines: vlines } }, yAxis: { title: { text: YTitle } }, tooltip: { formatter: function() { return '<b>'+ this.x +'</b>: '+ (this.y).toString().replace(/\B(?=(\d{3})+(?!\d))/g, separatorS); } }, plotOptions: { area: { marker: { radius: 1 }, lineWidth: 1, states: { hover: { lineWidth: 1 } }, threshold: null } }, legend: { enabled: false }, credits: { enabled: false }, exporting: { buttons: { exportButton: { enabled:false } } }, series: [ { type: 'area', name: 'Values', data: valuesArray//[973, 914, 4054, 732, 34] } ] }); } |
•Make sure you edit the .CSS files as well (edit the desktop\W010styles.css, tablet\W010styles.css, and smartphone\W010styles.css files) so that you use the appropriate class names as edited previously (using the W011AC prefix instead of W010LC).
5. Edit the simulationData.json file that defines the values taken for the simulation of the Widget.
This will allow you to test your Widget before propagating changes to the tablet and smartphone implementations.
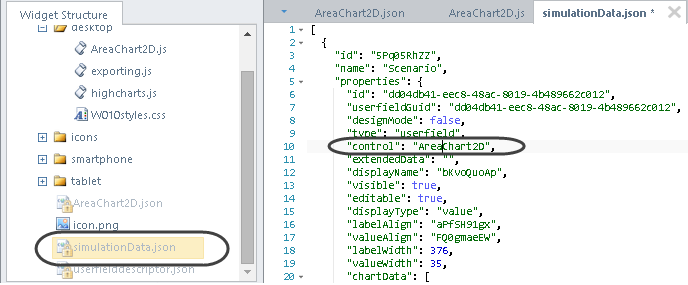
•Make sure you specify:
control: "AreaChart2D"
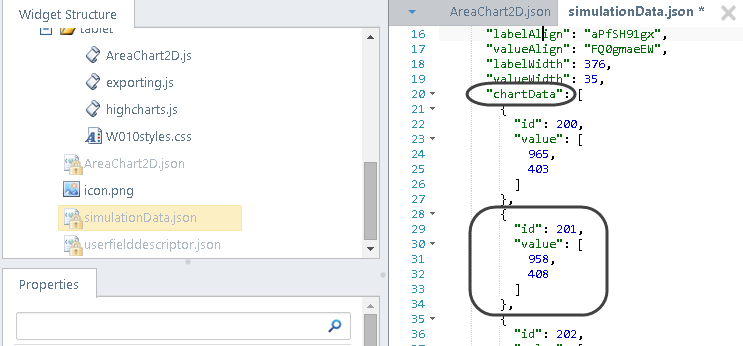
•You may also include additional dummy information for the chart to display more information.
Add records by repeating occurrences of (making sure you separate them with commas) this code: {"id": 200, "value": 1,603]}, where you may use any id, and any set of values, preferably in the paired values having a sequence for the first value, and the actual value that is pin-pointed in the chart:
|
You may use the following dummy information to test your chart: "chartData": [ {"id": 201,"value": [ 1, 603]}, {"id": 201,"value": [ 2, 508]}, {"id": 202,"value": [ 3, 551]}, {"id": 203,"value": [ 4, 410]}, {"id": 204,"value": [ 5, 601]}, {"id": 205,"value": [ 6, 453]}, {"id": 206,"value": [ 7, 702]}, {"id": 207,"value": [ 8, 551]}, {"id": 208,"value": [ 9, 775]}, {"id": 209,"value": [ 10, 615]}, {"id": 210,"value": [ 11, 615]}, {"id": 211,"value": [ 12, 726]} ], |
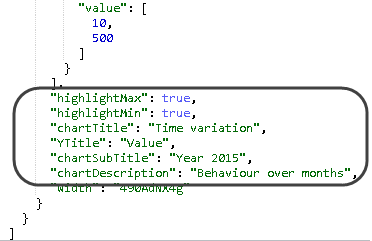
•You may also edit the randomized string labels assigned by default for string-type attributes, or any other of the configurable parameters of the Widget:
•Click the Run button to start the simulation and verify your result:
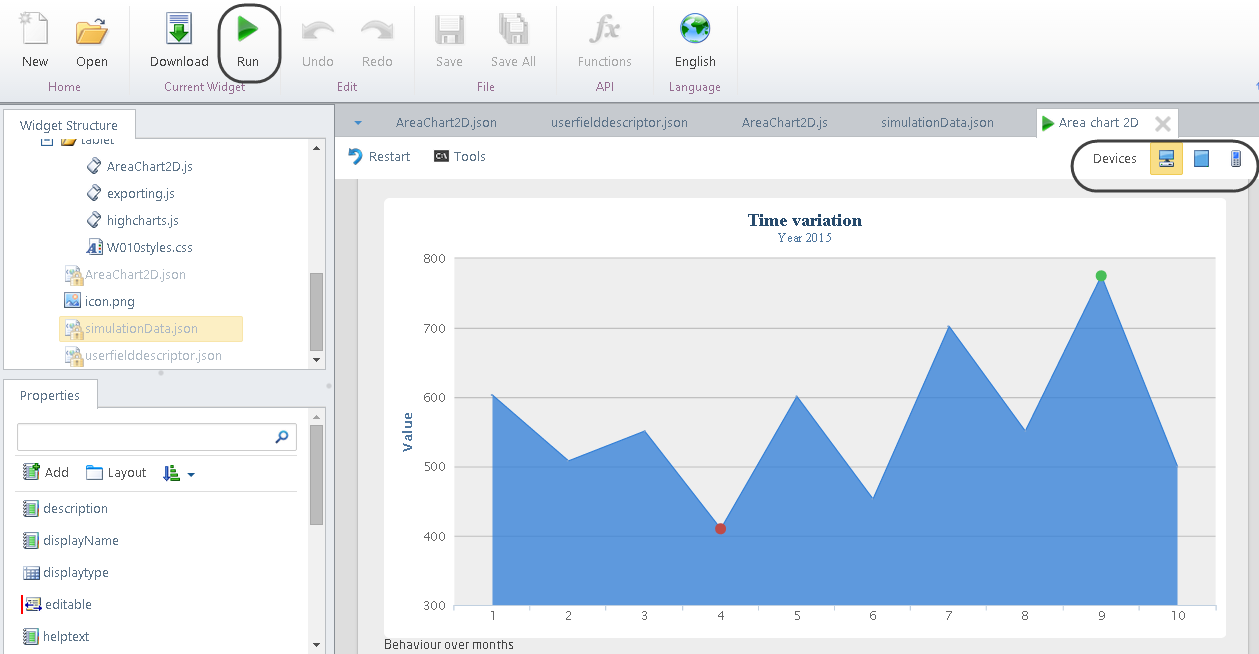
6. Propagate the changes of the desktop implementation for the other devices.
The easiest way to do this is by copying the whole contents of the desktop\AreaChart2D.js file.
In the example below, we illustrate this by first removing the old files (for both tablet and smartphone):
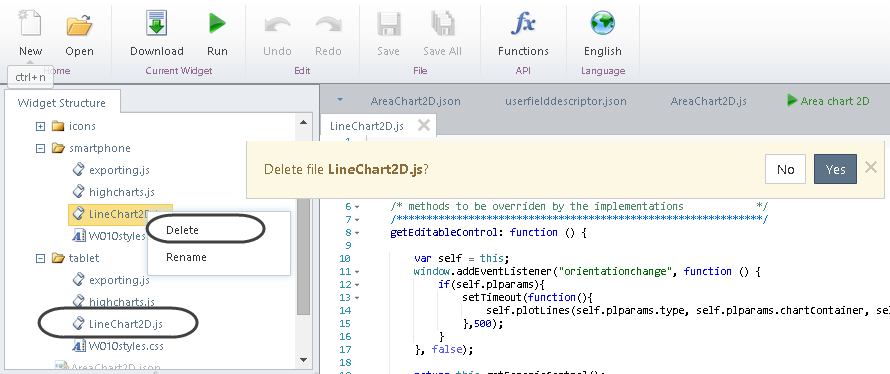
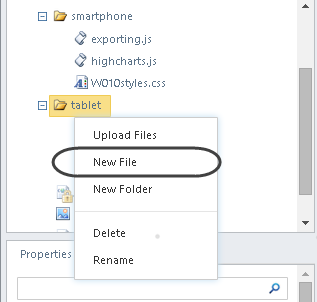
And then create the new files and name them the same: AreaChart2D.js (for both tablet and smartphone):
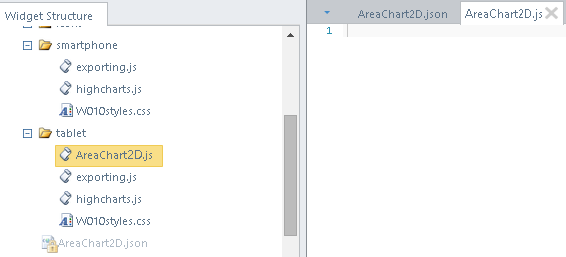
Copy the whole content of desktop\AreaChart2D.js into the newly created blank files (for both tablet and smartphone):
Finally and optionally, you may change the icon.png being used as a thumbnail to display the control in the Forms Designer of Bizagi Studio.
The easiest way to do this, is to drag and drop the new file and make sure you delete the old icon.png, and rename the newly included one to take the same name.
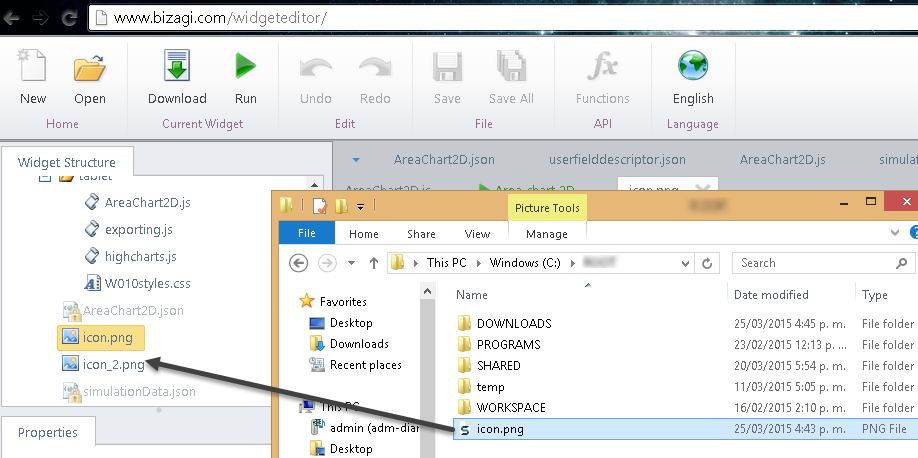
|
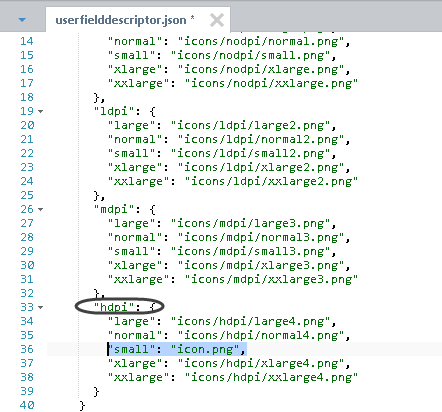
If you do change the icon to display, make sure you edit the following line at the userfielddescriptor.json that specifies the location of the thumbnail file. Edit directly the one for the hdpi element, with: "small": "icon.png",
|
7. Download and produce the final Widget .bwg file.
To do this, click the Download button to save the Widget locally.
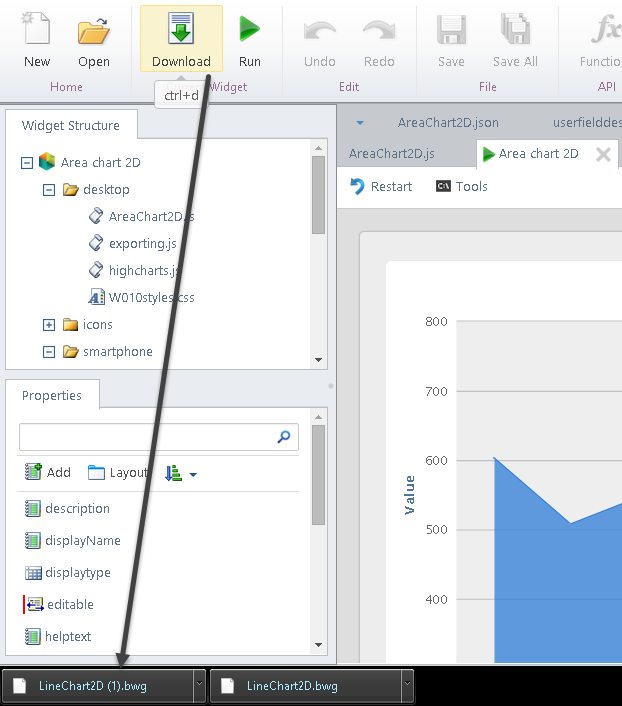
Make sure you name or rename the file accordingly to avoid confusions:
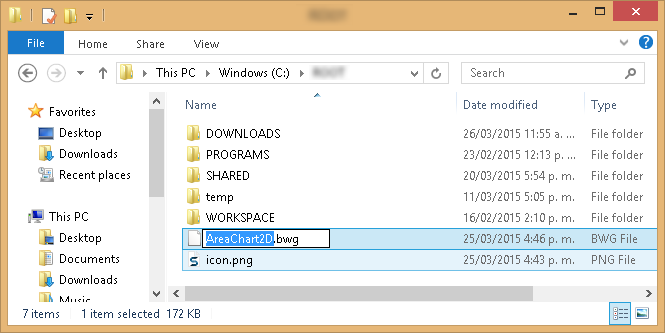
Now that the Widget has been produced as a file, you may include it in your project and share it with your project's team members.
To include it in the Studio, use the Bizagi Studio Widget administration options:
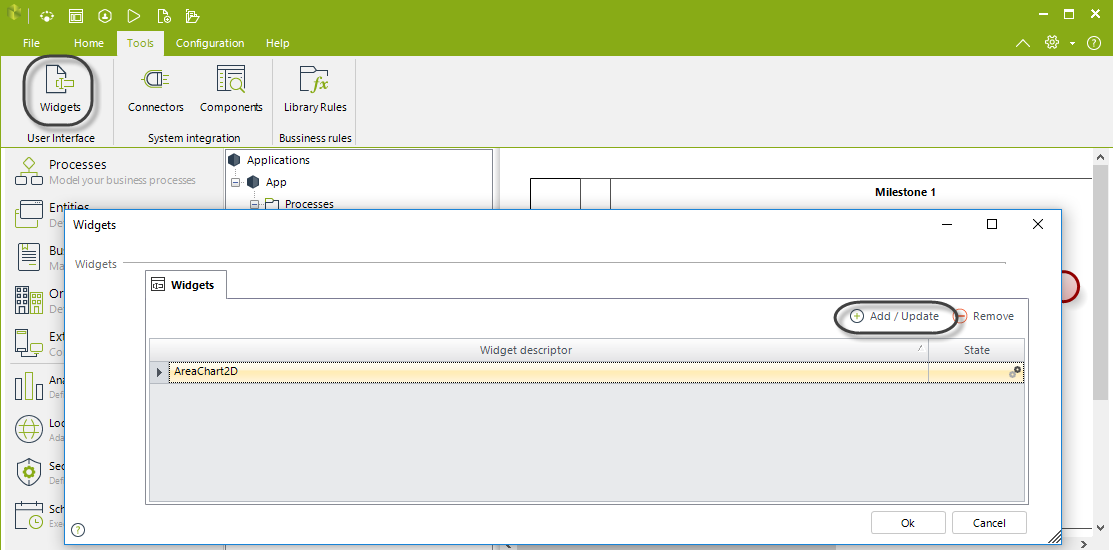
Once registered in your project, you may include it in your process forms directly from the Charts category:
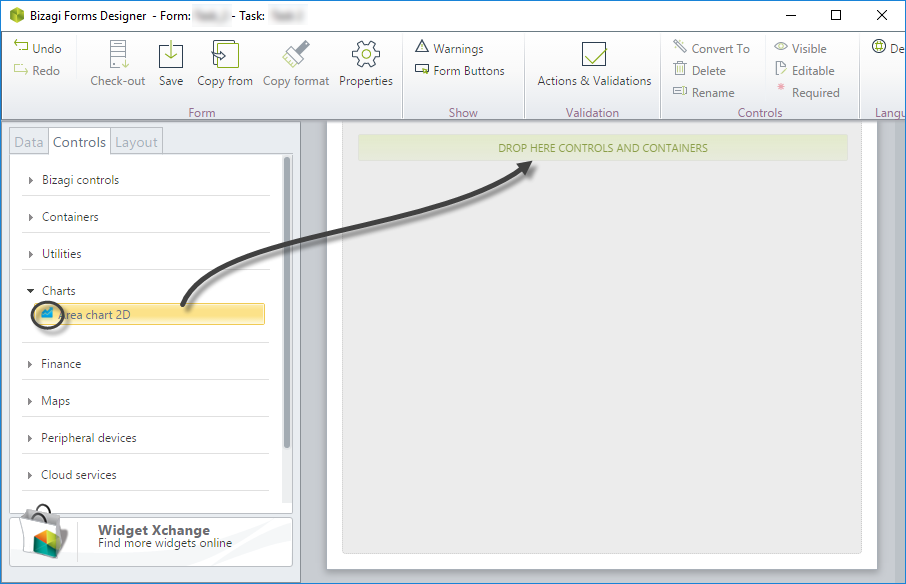
Make sure you configure its properties accordingly:
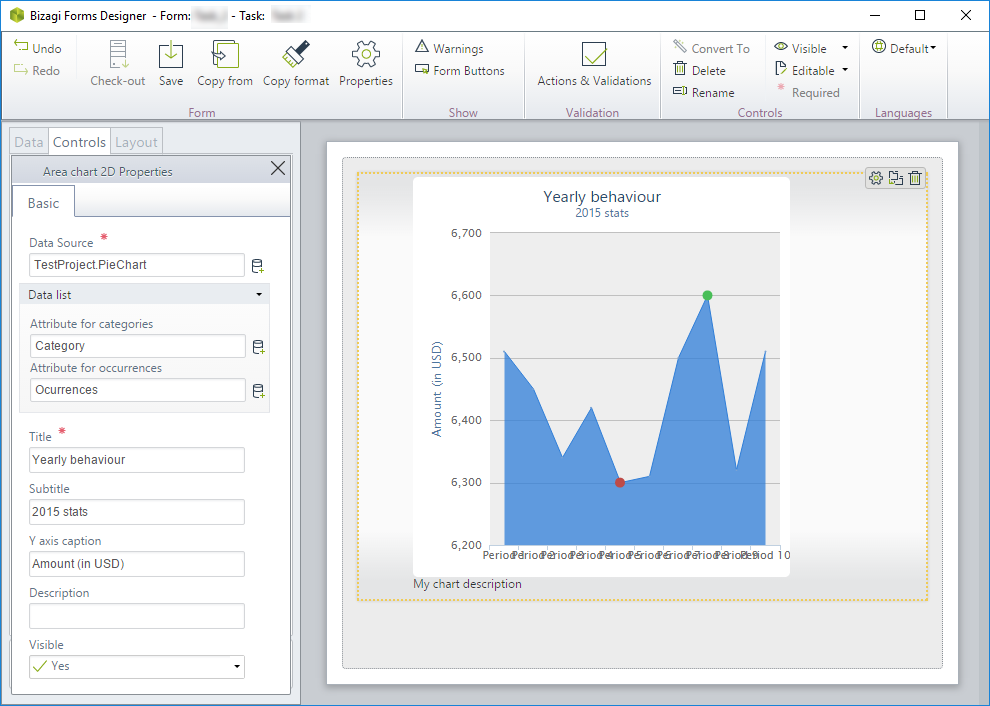
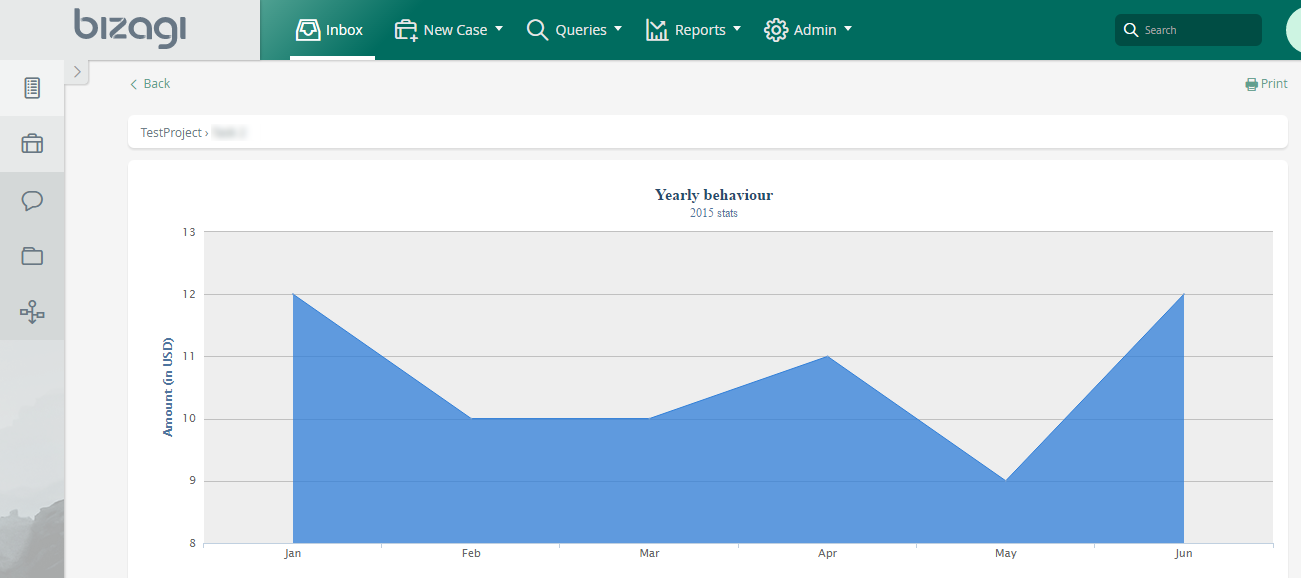
On execution, it will display the data you have in the configured collection table:
Last Updated 7/30/2025 1:42:12 PM
