Overview
There are different levels to troubleshoot or debug your Widget.
Before troubleshooting in Bizagi and by all means, you should first make sure:
1. That your code works, separately from Bizagi
This means having previously ensured in a separate demo.html file, that the code used by your Widget is working.
2. That within the Widget Editor, the Widget simulates just fine
Note that when creating a Widget using the Widget Editor, you have the possibility to simulate its behavior as it would function in Bizagi.
Through the simulation options, recall that the simulation tools provide a built-in console which prints error messages present when running the Widget.
For more information, refer to Simulation of your Widget.
Additional aspects to consider
In order to troubleshoot your Widget inside of Bizagi, consider the aspects below to narrow down where problems may lie.
1. BWG file consistent?
Once you generate a Widget as a .bwg output, make sure that no errors are shown when you install your Widget into your Bizagi project.
You do this by registering the Widget in Bizagi Studio, and making sure that this step does not show any error messages either when registering it for the first time, or updating it.
If there are any errors, you will most likely need to review your Widget’s structure to ensure that all referenced files are properly imported.
2. Loads in Forms Designer?
After a successful installation of your Widget, make sure that it displays properly when you include it into one of your Forms (through the Forms Designer).
By including the Widget (that is, dragging and dropping it) into the Form, you should be able to see:
•That the Form immediately draws whatever the Widget is supposed to draw.
Though dynamic behaviors (such as on-click events) may not be available, Bizagi will display the reserved space by the Widget in the Form.
•That the properties panel correctly loads all the properties you defined for design, that are up for configuration.
If you include the Widget and notice that the Forms designer freezes, does not display it properly, or alters the rest of its design, this indicates that the Widget contains errors and some of its information is not functioning as expected.
This issue may be caused by either an incomplete definition of its properties or a faulty implementation (even a single line of code causing an error can result in such alterations).
In this case, do not save the Form.
You may also want to delete the installed Widget and upload it again with the necessary adjustments, and rely strongly on the simulation features of the Widget Editor.
3. Loads on the Simulation and on runtime, but not doing what is supposed to?
Finally, once the Widget displays correctly, you can test it in the Work Portal.
This also applies if your Widget's simulation is not working as expected, but only if the Widget contains no syntax errors.
|
Recall that you may use your browser’s debugging and developer options (frequently shown with the F12 key, and as described in the section below) which include the same traces options such as console.log() that write directly into the browser's JS console (supported in Chrome and Mozilla).
|
When testing it on the Work portal on runtime, we recommend relying on the browser's debugging tools to test and troubleshoot Widgets.
Google Chrome is strongly recommended for this purpose because of its helpful tools.
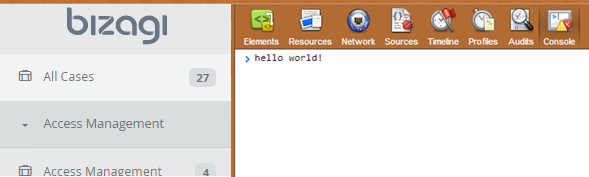
For instance, you may include debugger clauses inside the lines of code in your Widget, for a quick and easy alternative to adding breakpoints.
By simply opening the developer tools' console (i.e, using F12 in Chrome) you will be taken directly to debugging breakpoints:

Alternatively, you may debug the Widget in the browser, either directly when using the Widget Editor or when it is already part of your Bizagi project, by follow these instructions:
1. Include at the end of your implementation file, a line having:
//# sourceURL=MyWidget.js
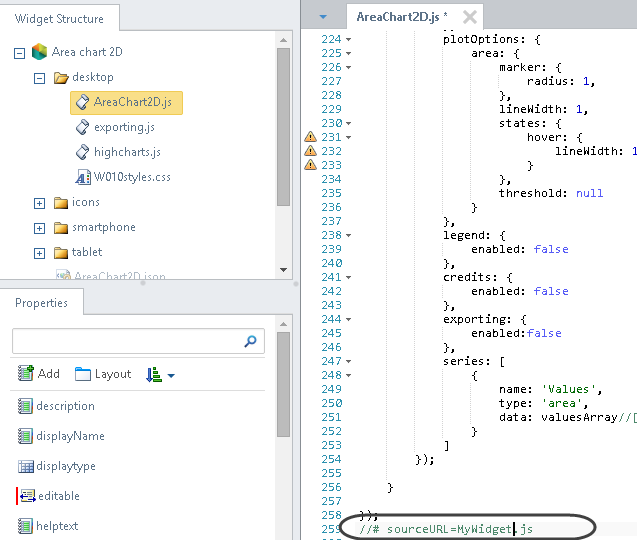
2. Make sure you build the Widget file, include it in your project and configure it and use it in an Activity Form.
Then, execute the process to view the behavior in Chrome.
For more information about this step, refer to the Widgets Management.
3. Use the developer options as shown when pressing F12, when running the Widget in Chrome (specifically when opening the form of the activity in which you have the Widget).
4. Go to the Sources tab to open the source file that has your implemented function.
You may open and search for the MyWidget.js source by pressing CTRL + P (or CTRL + O) and by entering the name of the MyWidget.js file:
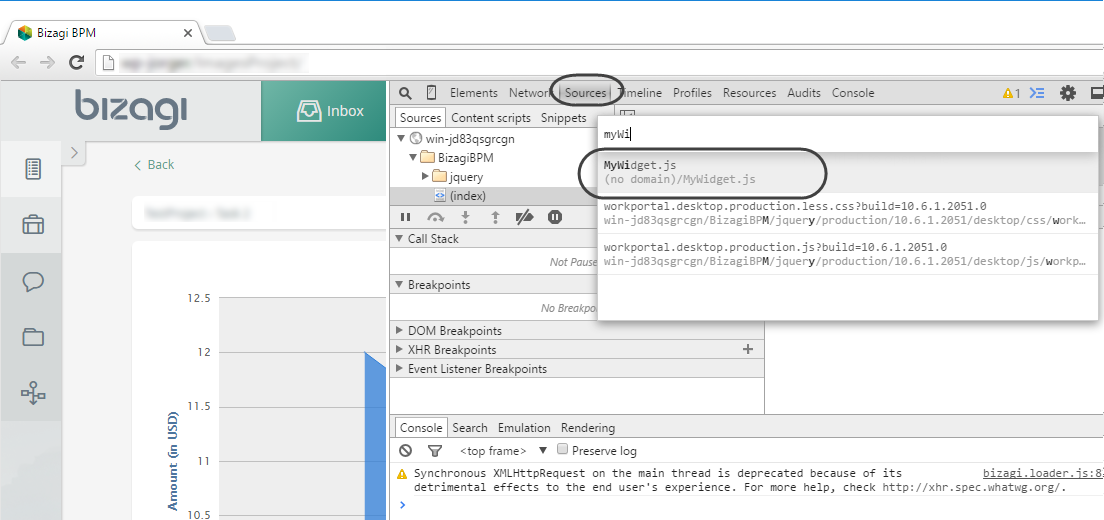
When clicking on the MyWidget.js result, the code of your implementation will load.
5. Place breakpoints as appropriate, in the very first line (or any line) inside of the function that displays your Widget.
Recall that the function called when displaying the Widget can be one of the following: getEditableControl, getReadOnlyControl, getGenericControl, or renderComplex, depending on your scenario (whether the Widget is set as editable, read-only, or if this setting is irrelevant).
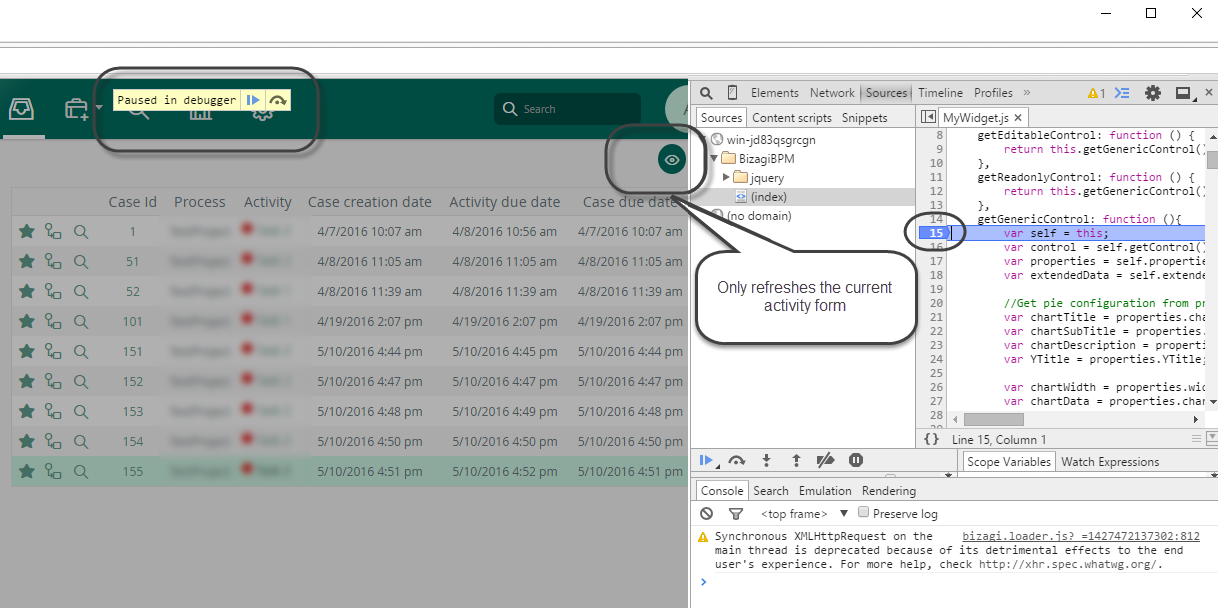
Once you have at least one breakpoint, click the refresh icon located at the top right corner, in order to only refresh that given form you are standing at.
Upon a refresh, you will see Chrome pausing the execution at the breakpoint so that you can use regular step-over and step-into debugging options.
|
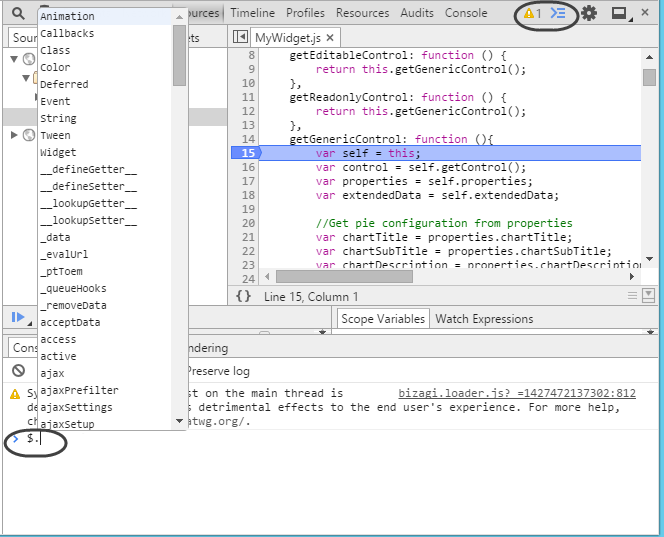
Recall that you may also type directly into the browser's JS console the jQuery sign ($) and a dot to use IntelliSense, in order to verify that the jQuery library is loaded up and avoid conflicts:
|
Important Considerations
•It is strongly recommended that you are, or become familiar with browser debugging tools and advanced developer options. This knowledge will help you diagnose specific issues with your Widget. Additionally, keep in mind that any debugging options added during development should only be temporary; ensure these are removed afterward.
oA finalized Widget released to production must never include such clauses due to security and performance best practices.
•For additional information on debugging, you can refer to Chrome's official documentation at: https://developer.chrome.com/devtools/docs/javascript-debugging.
•Please note that if you make changes to your Widget and want to test them directly in Bizagi, you will need to refresh your browser.
•When creating or using widgets that require calling external web services, it is crucial to ensure compatibility with the Content Security Policy (CSP) settings of your Bizagi environment.
Last Updated 9/16/2025 1:32:43 PM