Overview
As mentioned before, the Bizagi Modeler Process Mining is focused on the Process Discovery procedure. This article explains how to use this feature to discover your company processes.
Before you start
To be able to use the Process Mining feature you must:
•Have Bizagi Modeler desktop application installed.
•Have the event logs of the process to be created. The following formats are supported:
oExtensible Event Stream (XES) format as input.
oComma Separated Value (CSV) used in custom logs.
What you need to do
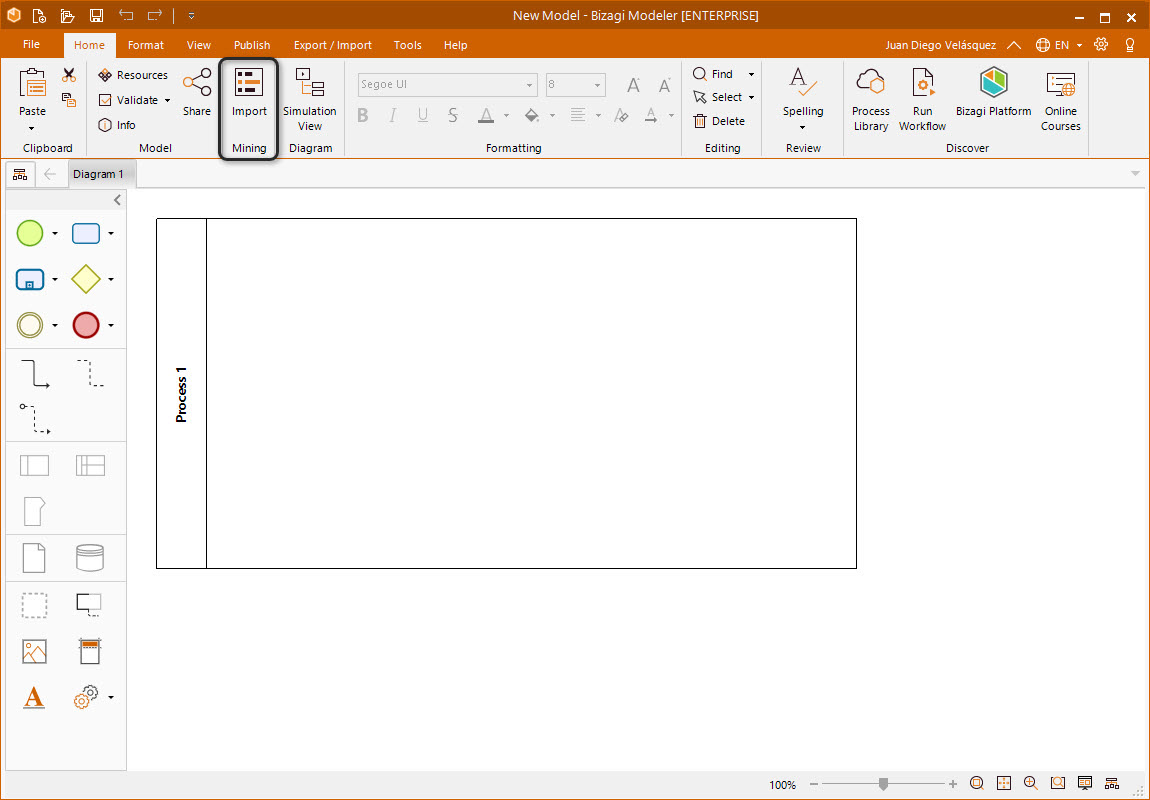
To access the Bizagi Modeler Process Mining feature, click the Import button in the mining section in the Home tab of the ribbon.
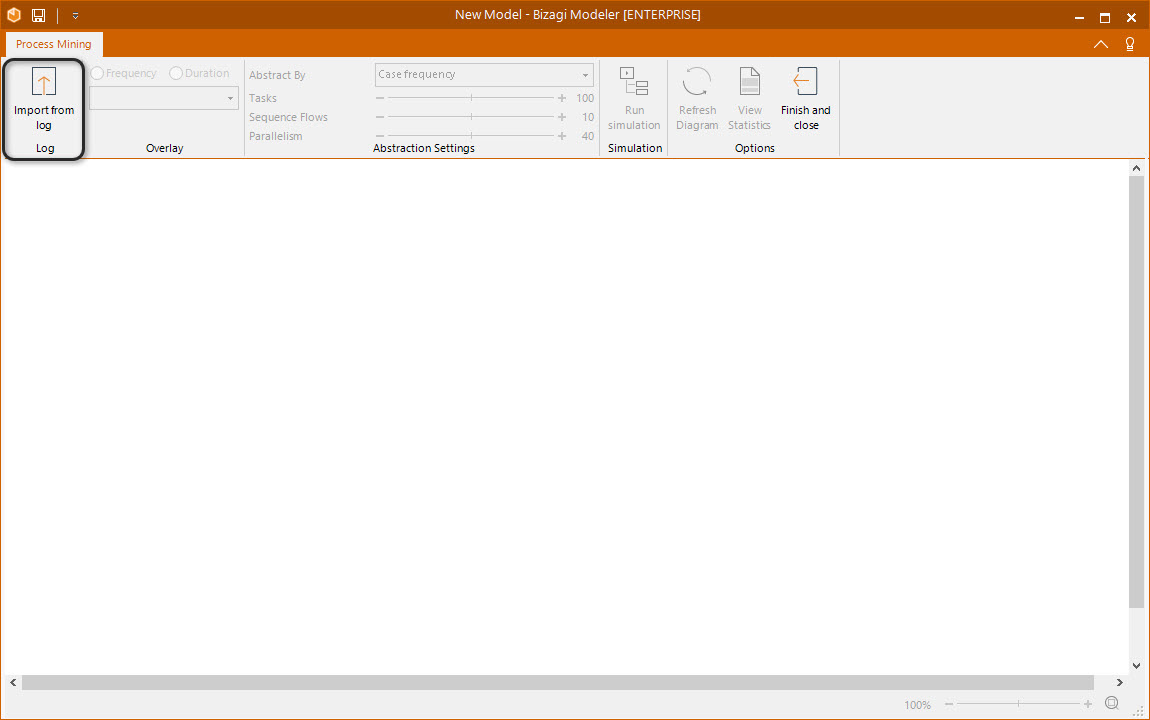
The Process Mining interface appears. The first thing you need to do is import the event log from which the process is going to be based. To do so click the import from log button.
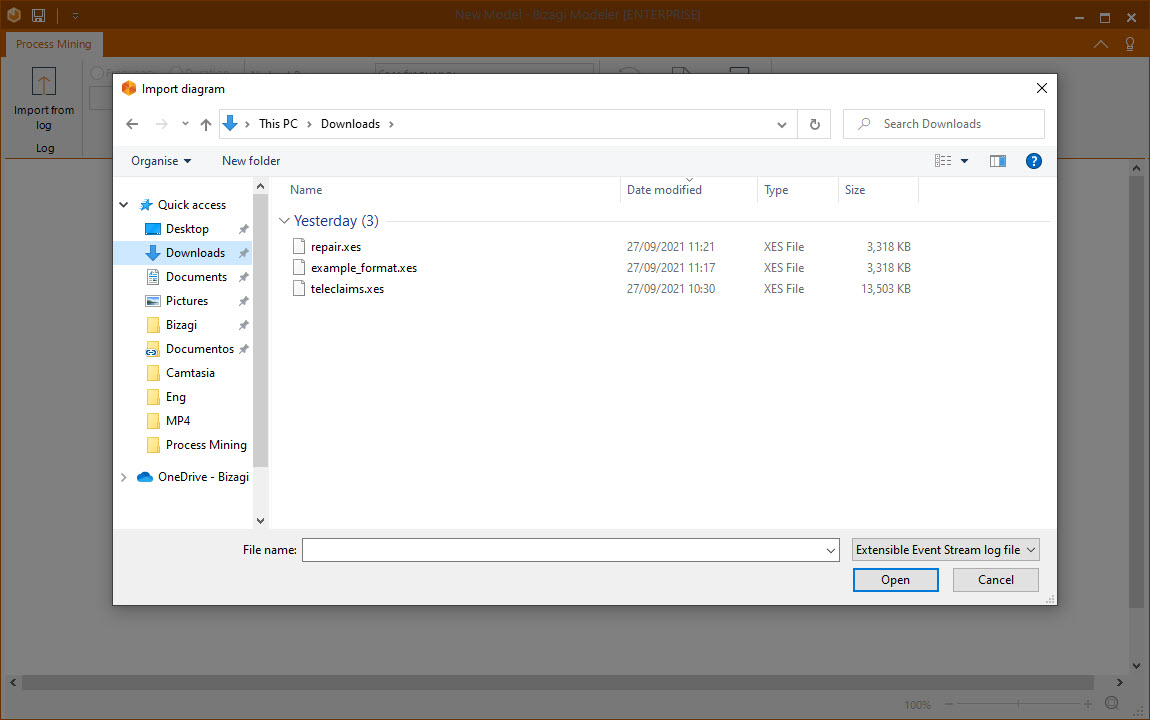
The file explorer appears for you to select the event log desired. As mention before, Bizagi Modeler Process Mining supports both Extensible Event Stream (XES) and Comma Separated Value (CSV) formats. You can also create custom logs with the CSV format.
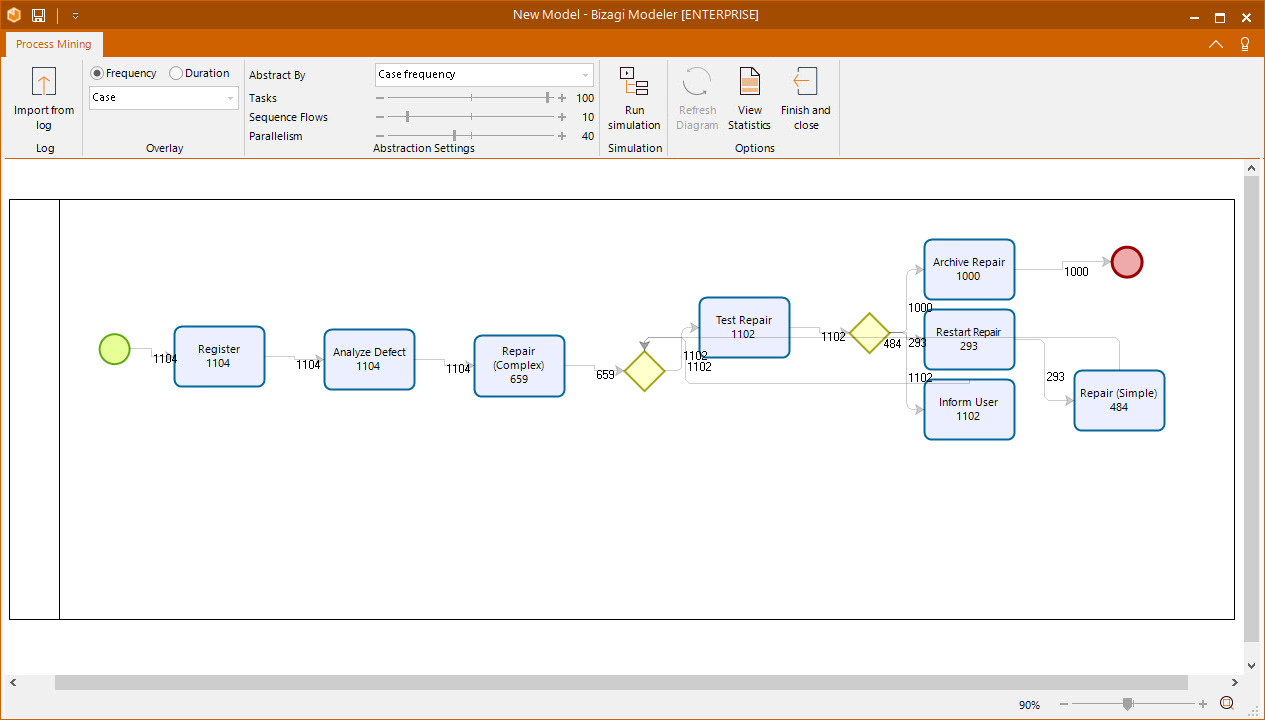
Once you select the file, the mining engine starts to import the diagram. This may take some time depending on the size of the event log selected and your internet connection. When finished, the entire interface is enabled for you to analyze the process.
Process Mining Interface
The Process Mining interface is very simple and easy to use; it consists of 2 main sections: Overlay and Abstraction Settings.
Overlay
This section controls the statistical data that is shown within the diagram. There are two types of statistics: Frequency and Duration. Frequency is the case frequency within the event log, and Duration is the time measurement of the events in the log. When the diagram is created, by default, the type of data shown is by frequency and the measure is the number of cases.
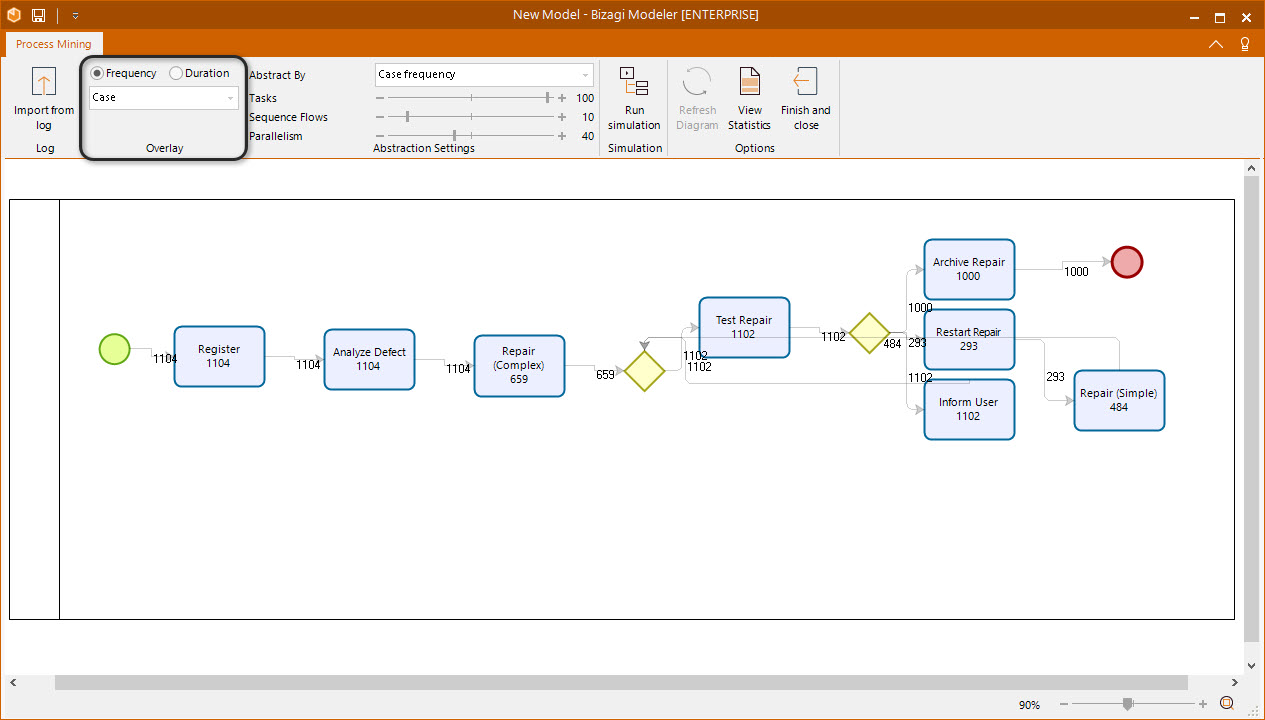
In the following table, each possible measure is explained.
Type of Data |
Data |
Description |
|---|---|---|
Frequency |
Case |
The number of cases that went through the task or sequence flow. |
Relative Case |
The percentage of cases that went through the element. |
|
Total |
The total number of times the cases went through the element (reprocesses). |
|
Average |
The average number of times the cases went through the element. |
|
Median |
The median number of times the cases went through the element. |
|
Min |
The minimum times a case went through the element. |
|
Max |
The maximum times a case went through the element. |
|
Duration |
Total |
The accumulated time that the task or sequence flow spent in all the cases. |
Average |
The average time the element spent to process each case. |
|
Median |
The median time the element spent to process each case. |
|
Min |
The minimum time the element spent to process a case. |
|
Max |
The maximum time the element spent to process a case. |
When you select a different type of statistic or measure the model is refreshed automatically and the new data is displayed.
Abstraction Settings
The abstraction settings are the most important part of the Process discovery procedure. These settings determine the way the process is created based on the event log. There are two ways of abstracting the process: by the case frequency or by the average duration (in the same way as in the Overlay). When you abstract the process by case frequency the feature prioritize the tasks and sequence flows that have higher case frequency. On the other hand, when you abstract the process by average duration the feature prioritize the tasks and sequence flows that have higher average duration.
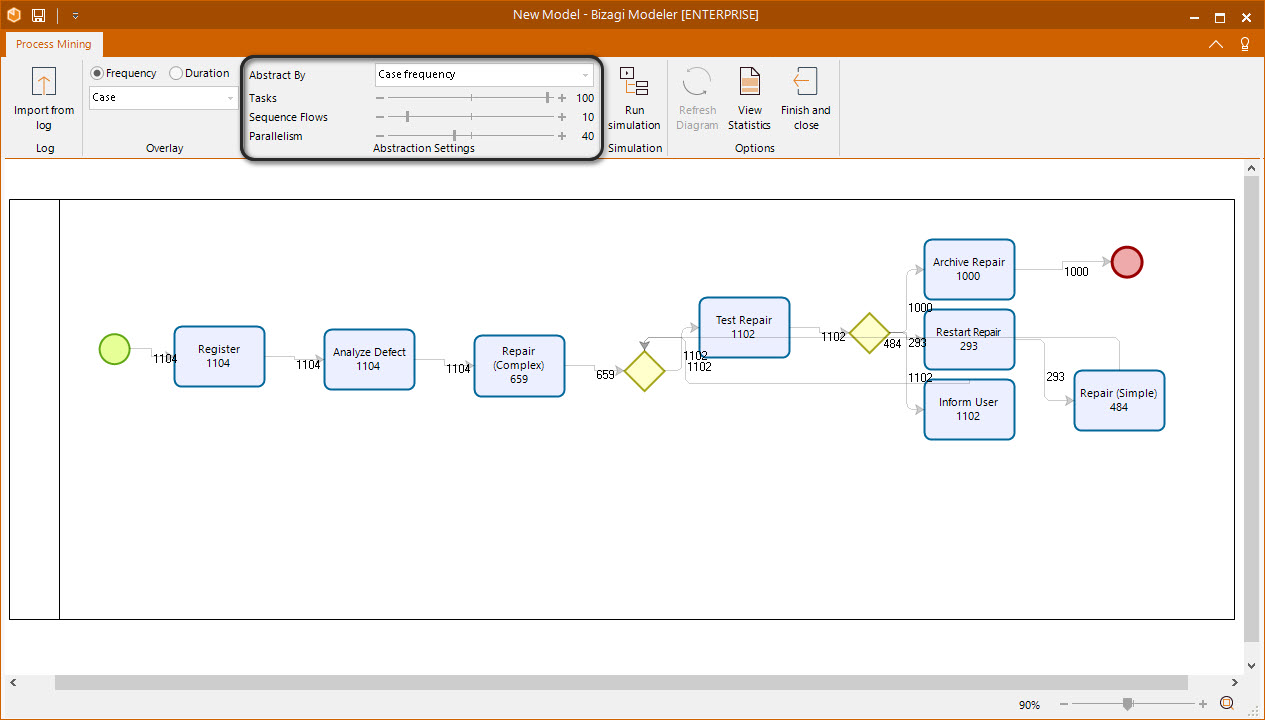
Once you have selected the abstraction type, you can modify the Task, Sequence flow and Parallelism parameters to achieve the desired process. Each parameter determines an important aspect of the process:
•Task: determines the percentage of tasks to show in the new model based on the event log. If this parameter is at the minimum, the model created will take the event logs with the least amount of tasks, in the same way, if it is at the maximum, the model created will have all the possible tasks.
For example, at 1 percent with an event log that has cases with 3 or more tasks, the number of tasks will be 3 if possible. On the contrary, at 100 percent with an event log with a total of 8 tasks the number of tasks would be 8 if possible.
•Sequence Flows: determines the percentage of arcs (sequence flows) to show in the new model based on the event log. If this parameter is at the minimum, the model created will show the least amount of arcs possible, in the same way, if it is at the maximum, the model created will have all the possible arcs.
For example, at 1 percent with an event log that has cases with 5 or more arcs, the number of arcs will be 5 if possible. On the contrary, at 100 percent with an event log with a total of 11 arcs the number of arcs would be 11 if possible.
•Parallelism: determines the percentage of tasks that can be performed in parallel in the process. If this parameter is at the minimum, the model created will not have, if possible, parallel branches, in the same way, if it is at the maximum, the model created will have all the parallel branches possible.
When you change any of the abstract settings, it is necessary to click the Refresh Diagram button in the options ribbon to display the changes in the model.
Event log Statistics
When you import an event log to the Process Mining, a set of statistics are created based on said event log. To access them, click the View Statistics button located in the options section of the ribbon. This opens the statistic window; in the following table each statistic is described.
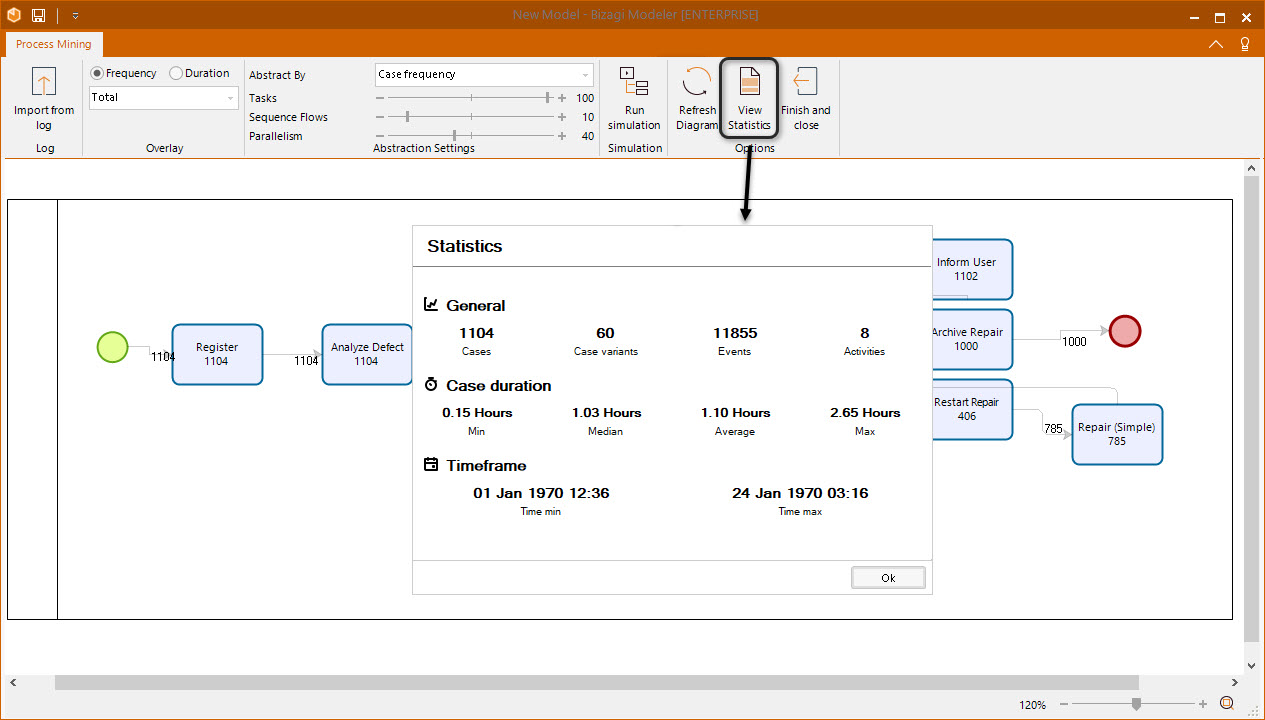
Type of Data |
Data |
Description |
|---|---|---|
General |
Cases |
The number of cases in the event log. |
Case variants |
The number of different paths the cases take. |
|
Events |
The number of records in the event log (number of Lines). |
|
Activities |
Number of non-repeated activities discovered in the log |
|
Case Duration |
Min |
The minimum time a case took. |
Median |
The median time of the cases. |
|
Average |
The average time of the cases. |
|
Max |
The Maximum time a case took. |
|
Timeframe |
Time min |
The earliest date in the event log. |
Time max |
The latest date in the event log. |
Creating the model
Once you are satisfied with the model discovered with the abstract settings, click the Finish and Close button in the options section of the ribbon.
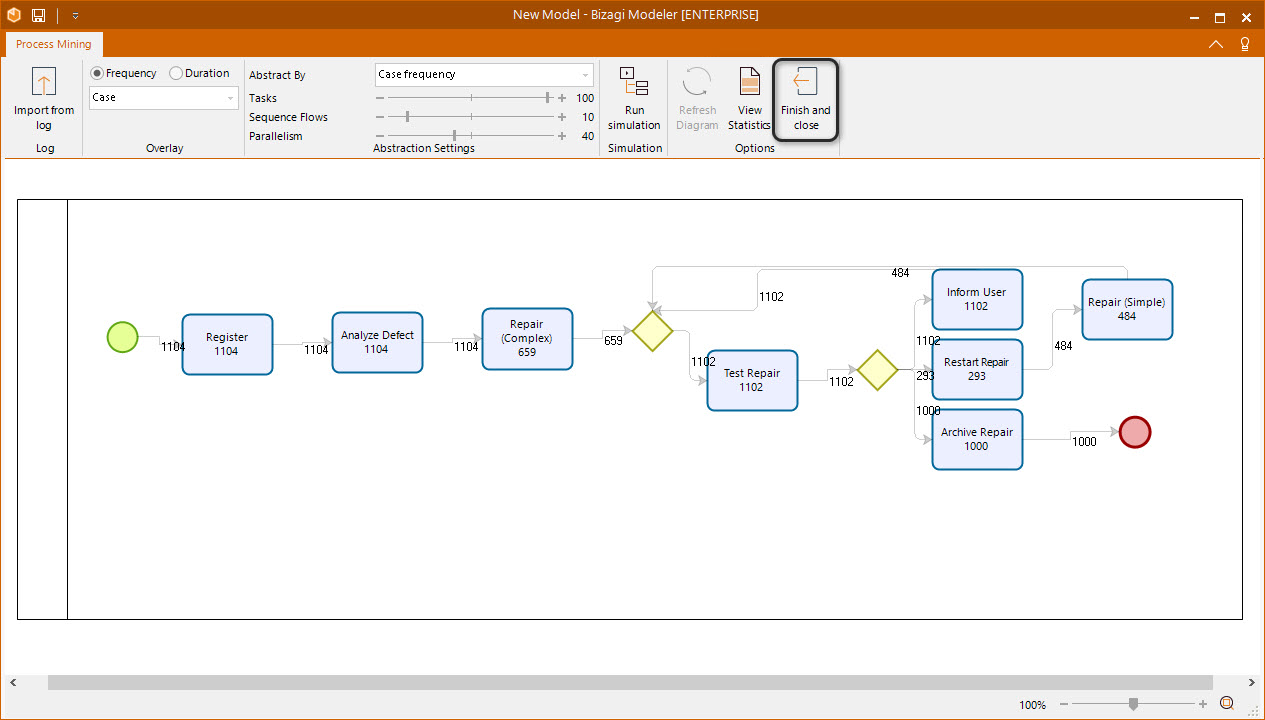
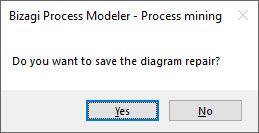
Bizagi Modeler shows a confirmation message to save the diagram discovered. Select the affirmative option.
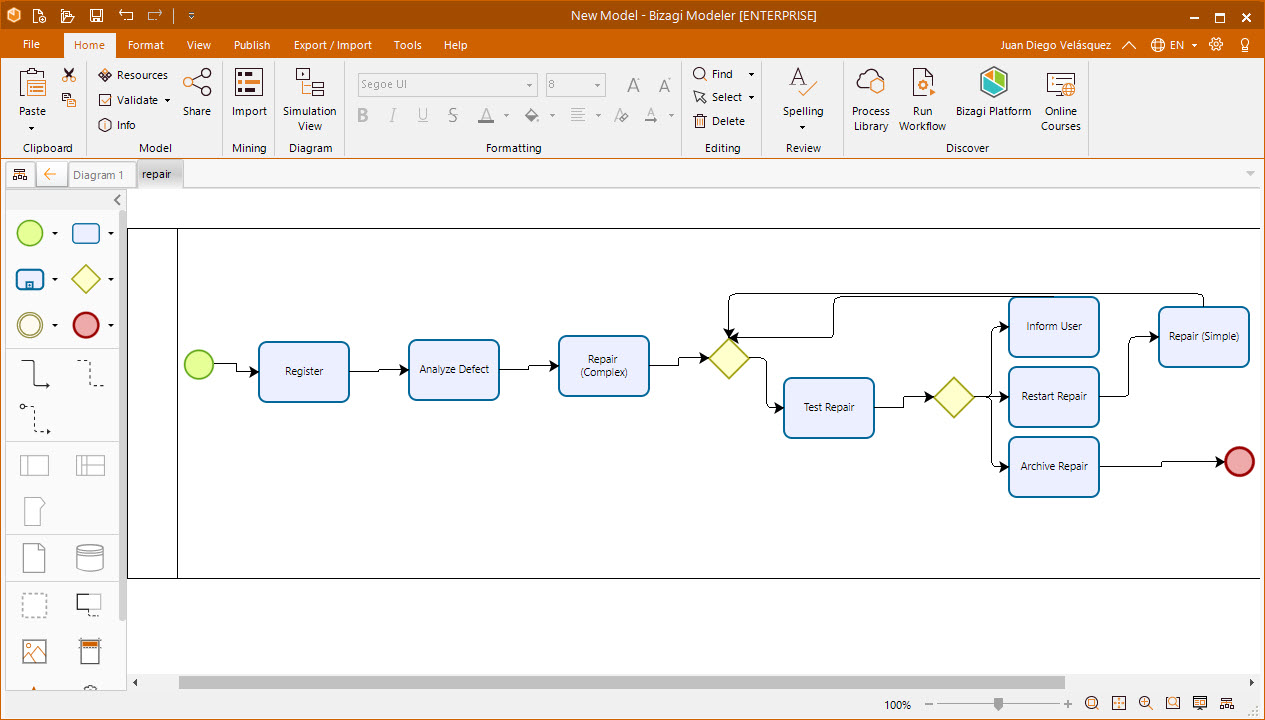
With this, the diagram is created and can be managed like any other diagram created directly in the workspace.
Considerations
•Since Process Mining is a heavy-duty task, the service could present slowness. This is the expected behavior and depends directly on the size of the log file and the internet connection.
•Event logs with more than 60MB size take more time to process and could hang the Process Mining engine.
•It is possible to upload event logs without the end date of an activity, however, this is reflected in the quality of the abstraction done by the Process Mining. The more detailed the event log, the better the abstraction.
•The diagrams discovered by the process mining do not always comply with the BPMN notation, it is necessary to validate them later on.
Generate custom event logs
As mentioned before the Bizagi Modeler process mining engine supports custom logs in Comma Separated Value (CSV) format. The only requirement is that the file must have the appropriate headers, these are case sensitive and must be in the given order:
•activityid
•caseid
•activitydescription
•activitycreationdate
•activitysolutiondate
The date and time format for the last two headers must be yyyy-MM-dd HH:mm:ss. The following is a brief example of a valid CSV file:
activityid,caseid,activitydescription,activitycreationdate,activitysolutiondate
63,552,CVG02,2020-02-02 04:57:12.857,2020-02-02 04:57:12.903
64,552,Is Customer Info complete?,2020-02-02 04:57:12.903,2020-02-02 04:57:12.937
65,552,Complete Customer Info,2020-02-02 04:57:12.937,2020-02-02 05:02:01.503
73,554,CVG02,2020-02-02 05:08:17.110,2020-02-02 05:08:17.127
74,554,Is Customer Info complete?,2020-02-02 05:08:17.127,2020-02-02 05:08:17.127
With custom event logs any user with a database can export data in the required format and use the Bizagi Modeler process mining feature.
Troubleshooting
When using the Process Mining feature, you may face three error messages:
•"A problem has occurred with the process mining services. Try again in a few seconds; if the problem persists, contact our support team."
This error may occur because the selected file is too large or due to the unavailability of any of the Process Mining services. if this problem persists, contact our support team.
•"The process mining service is not currently enabled in your subscription. Contact our support team to upgrade your environment."
This error occurs when the subscription's environment is not configured to enable the Process Mining services. To enable this feature, contact our support team.
•"Validate the format of your file. Follow the instructions found in the official Bizagi Process Mining documentation."
This error occurs when the user uploads a file with a different format from the ones supported, or when the CSV has errors such as incorrect headers or a different date and time format from the one required.
Next steps
From now on, the user will start the well known Model, Build, Run paradigm, but now with a headstart.
•Document the elements of the model created.
•Publish your complete documentation. You can choose between multiple formats.
•Exchange your model. You can exchange your model in multiple formats.
•Simulate the process flow with Bizagi Modeler simulation tool.
Last Updated 3/14/2022 8:13:48 AM