Overview
The Automation BPU report provides detailed information about Automation BPU consumption by applications, processes, activities, and AI agents across different time periods.
An Automation BPU is a unit that measures the processing capacity of an Automation Service environment. Automation BPUs are consumed based on process execution.
One Automation BPU is equivalent to 10,000 steps per month, where a step is any shape executed in a process diagram, except for the Start and End shapes.
To help you analyze consumption, the Automation report is divided into the following sections:
•Automation BPU consumption report per Application
•Automation BPU consumption report per Process
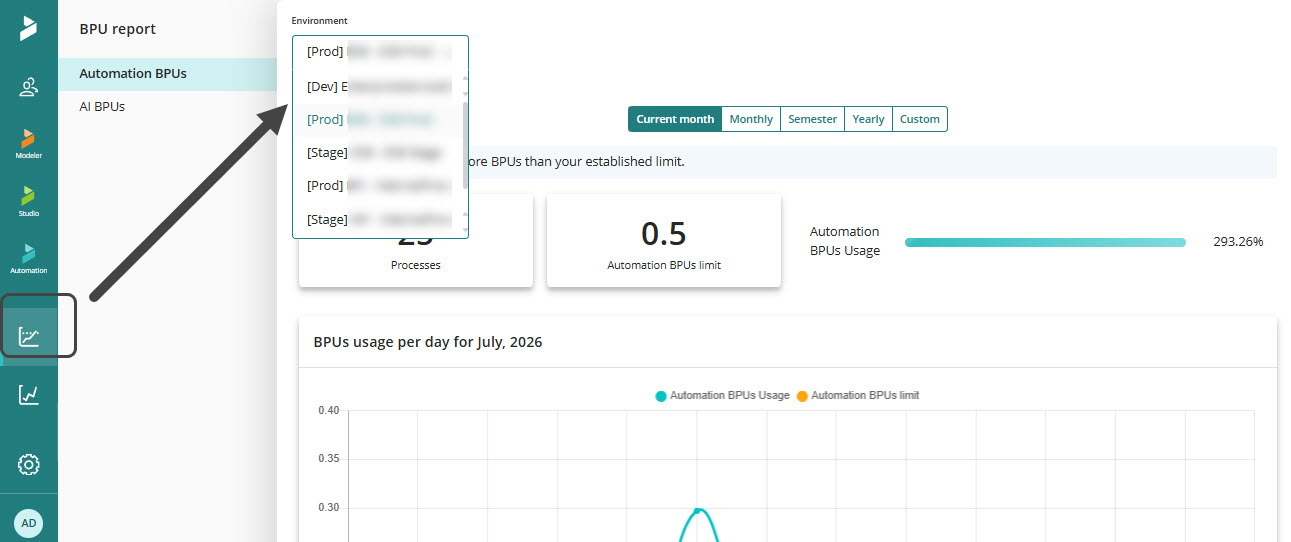
To access the Automation BPUs report, open the BPU report in the Customer Portal, select the Automation BPU report section and select your environment.
BPU consumption report per Application
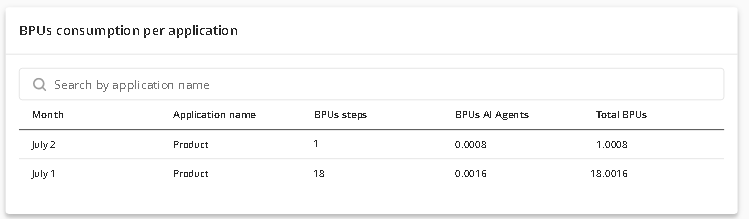
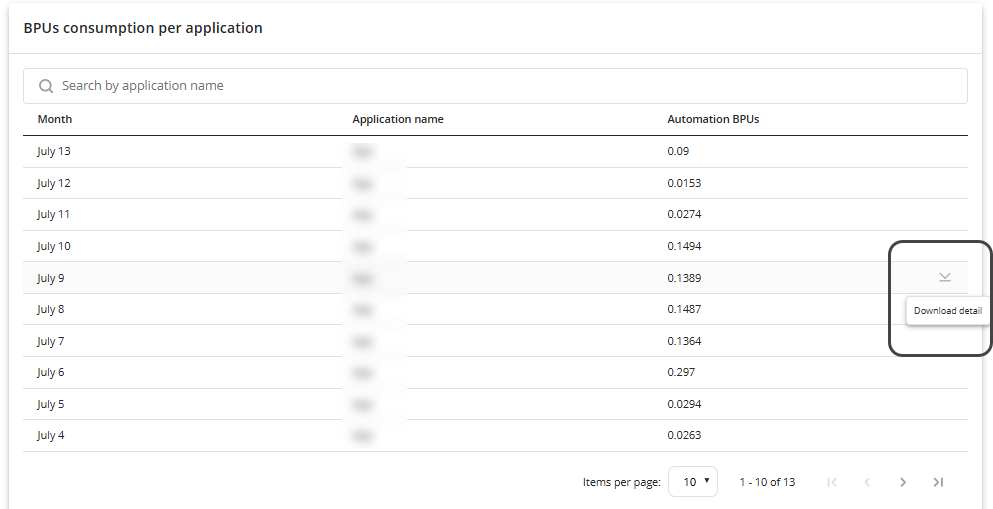
The BPU Consumption by Application section shows detailed BPU usage for the selected time period. It lists all applications that used BPUs during that time. If the time period is less than a month, consumption is shown daily; if it's more than a month, consumption is shown as a total for each month in the selected range. When you filter BPU consumption by application, a table will display the relevant data. Depending on the time scale you chose, you'll see the following tables:
•Table for daily application consumption.
•Table for monthly application consumption.
Table components
These are the following table components that measure the BPUs consumption by application:
1.Month: This column shows the date on which the BPUs consumption was generated. It can be accumulated on a monthly or daily basis, depending on the time scales: Current Month, Monthly, and Custom (less than 30 days). In the case of less than 30 days, it is detailed daily; on the contrary, it is considered as an accumulated consumption by month.
2.Application name: This column shows the name of the application that generated a BPUs consumption.
3.BPUs: This column represents the BPU expenditure for the application, categorized only for consumptions made by step processes. Depending on the time frame, if it's less than 30 days, consumption will be tracked daily; otherwise, it will be accumulated monthly.
BPU consumption report per Process
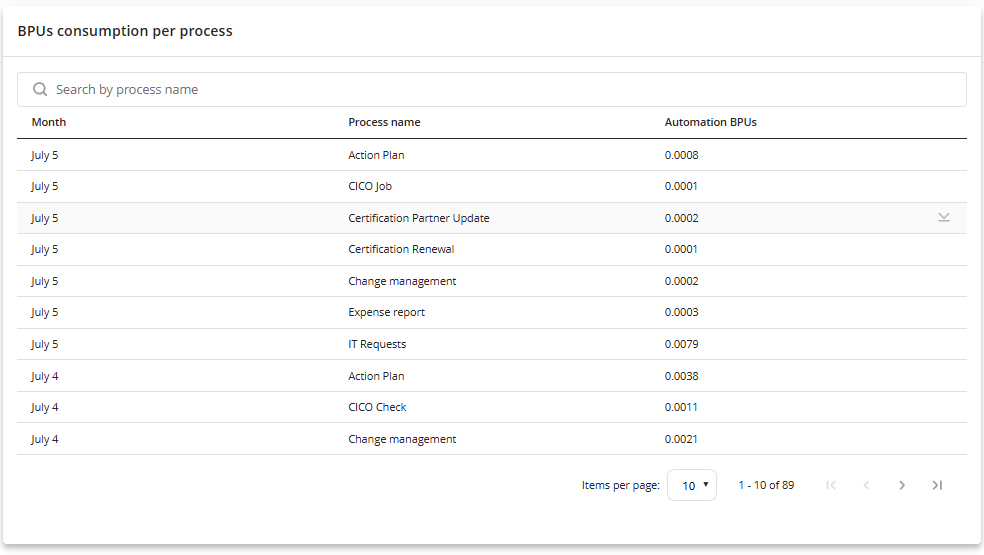
The BPU Consumption by Process section provides detailed information on BPU usage for the selected time period. It lists all processes that used BPUs during that time. If the time period is less than a month, usage is shown daily; if it’s longer than a month, usage is displayed as a total for each month within the selected range.
•Table for daily process consumption.
•Table for monthly process consumption.
Table components
1.Month: This column shows the date on which the BPUs consumption was generated. It can be accumulated on a monthly or daily basis, depending on the time scales: Current Month, Monthly, and Custom (less than 30 days). In the case of less than 30 days, it is detailed daily; on the contrary, it is considered as an accumulated consumption by month.
2.Process name: This column shows the name of the process that generated a BPUs consumption.
3.BPUs: This column represents the BPU expenditure for the process, categorized only for consumptions made by step processes. Depending on the time frame, if it's less than 30 days, consumption will be tracked daily; otherwise, it will be accumulated monthly.
Automation BPUs Views
The report has five time-views that allow you to narrow down the information of your resource consumption.
Depending on the report you access the details displayed may vary.
All BPU Reports provide a similar reporting experience, allowing you to analyze resource consumption through multiple parameters and date ranges.
Current month view
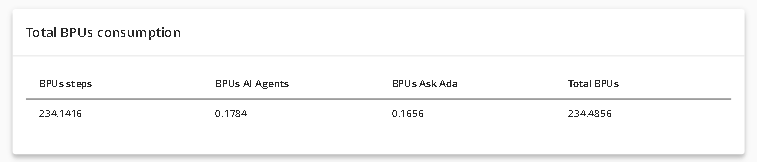
This view shows the BPU consumption of the ongoing month and the percentage usage. At the bottom of the screen, the table adapts to show the components involved and the number of BPUs consumed for each one.
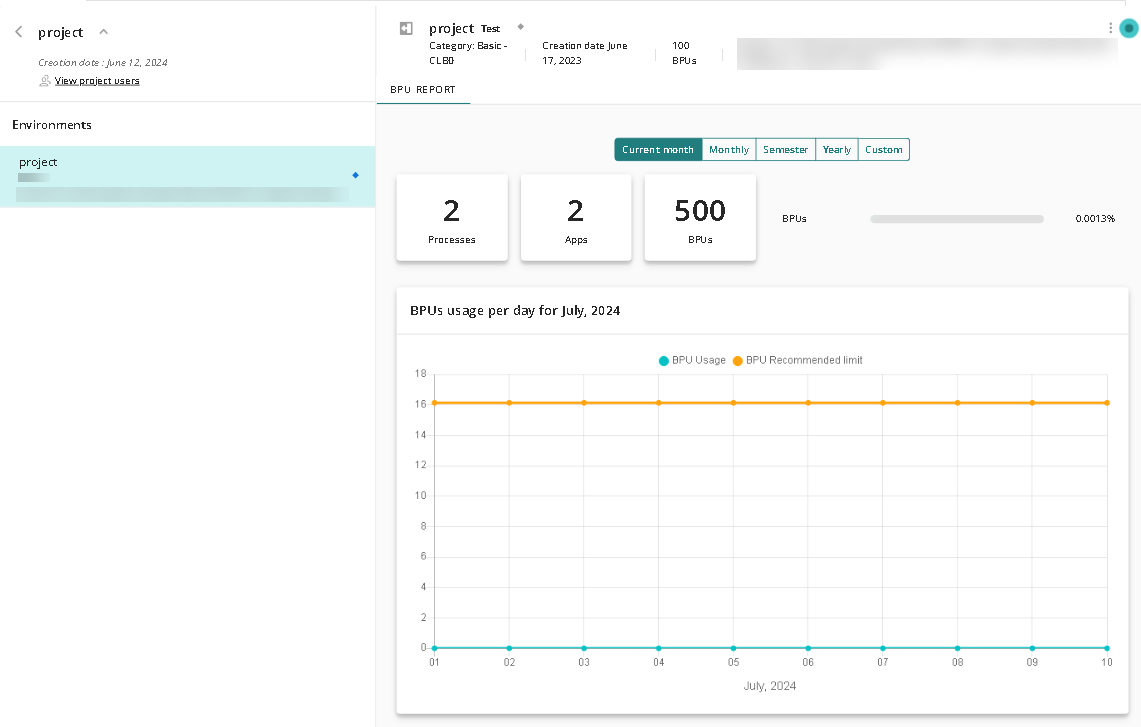
In this view you will see the following charts and tables:
Metric |
Description |
|---|---|
Automation BPUs usage |
Shows the percentage of BPUs consumed regarding to the number of BPUs purchased in the current month. |
Automation BPU limit |
Number of BPUs purchased in your environment. |
Monthly view
The monthly view shows the evolution of the BPUs consumption either per day or accumulated for the selected month, along with the number of BPUs consumed per component on the bottom. When the report is loaded it displays by default the month prior to the current one.
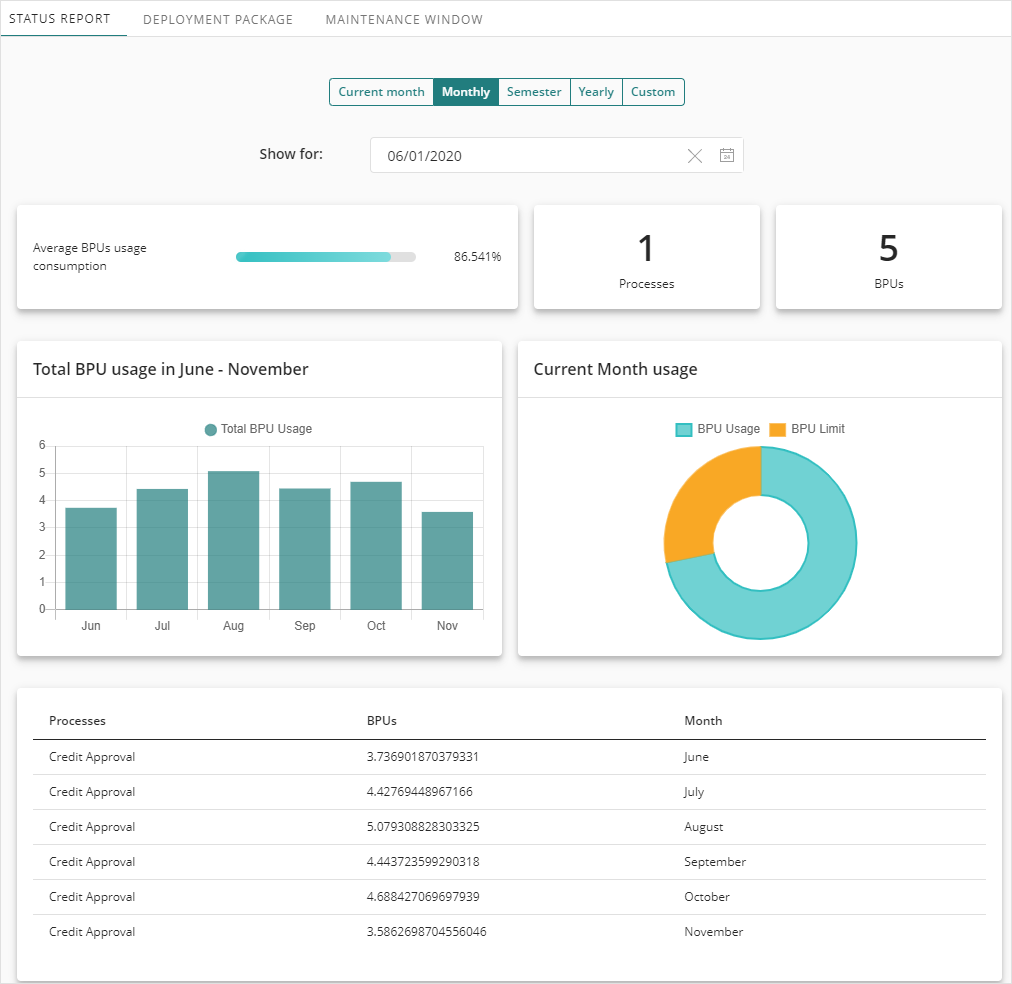
In this view, you will see the following charts and tables:
Metric |
Description |
|---|---|
Show for |
Indicates the month selected from which you generate the report. By default, the report shows the information for the last month. You can change the view per day or accumulated. |
Automation BPUs usage |
Shows the average percentage of BPUs consumed regarding to the number of BPUs purchased in the selected month. |
Automation BPU limit |
Number of BPUs purchased in your environment |
Semester view
The semester view shows the BPU consumption for six months as of the selected date. When no date is selected, the data for the last six months is displayed.
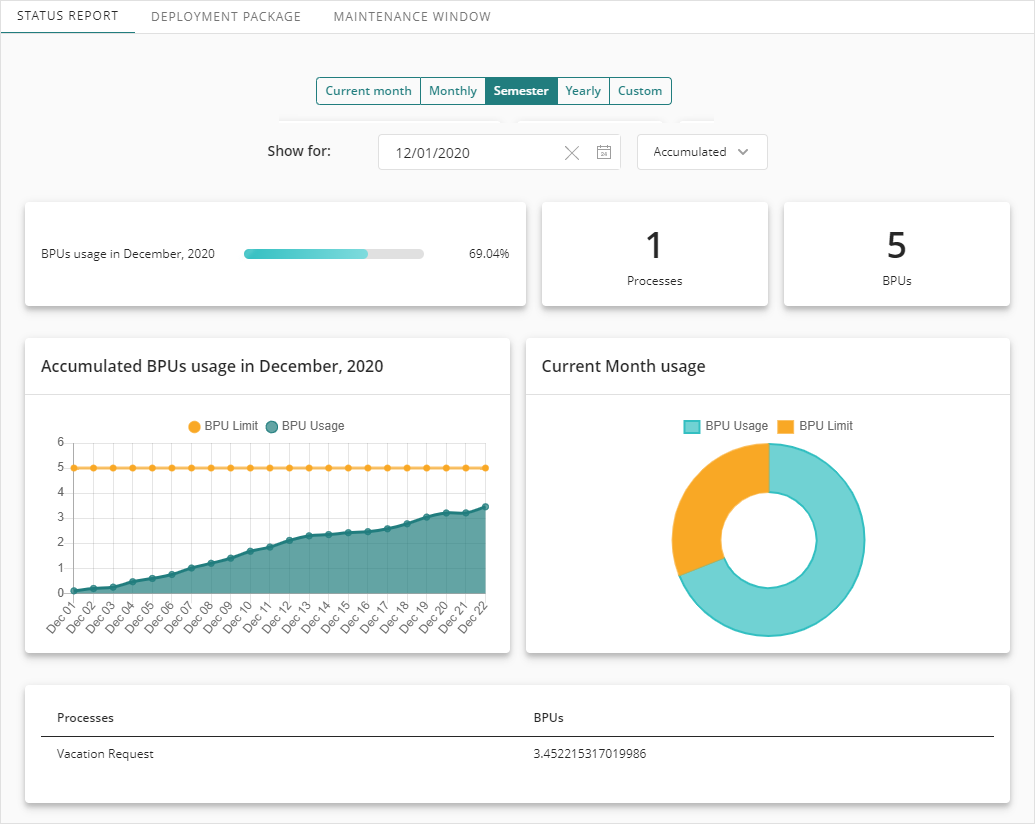
In this view, you will see the following options:
Metric |
Description |
|---|---|
Show for |
Indicates the month selected for the report. By default, the current month is selected |
Automation BPUs usage |
Shows the percentage of BPUs consumed regarding to the number of BPUs purchased. |
Processes |
Number of processes with opened or closed cases during the selected month. |
Automation BPU limit |
Number of BPUs purchased in your environment. |
Yearly view
The yearly view shows the BPU consumption of the selected year. When no year is selected, the data for the current year is displayed.
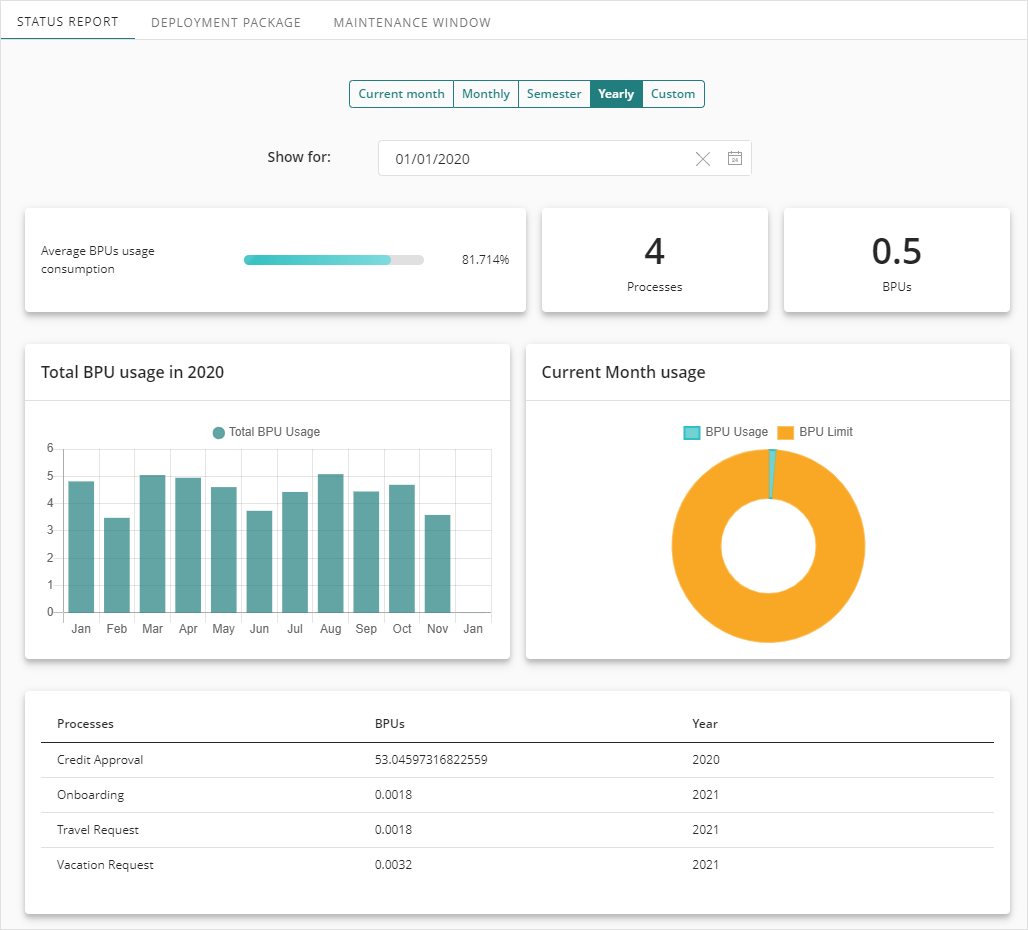
In this view, you will see the following charts and tables:
Metric |
Description |
|---|---|
Show for |
Indicates the year selected from which the report is generated. If no date is selected, the report shows the information for the current year. |
Automation BPUs usage |
Shows the average percentage of BPUs consumed regarding to the number of BPUs purchased in the selected year. |
Automation BPUs limit |
Number of BPUs purchased in your environment |
Custom view
The Custom view shows BPU consumption for a selected date range. Use the date filters to define the period to be included in the report.
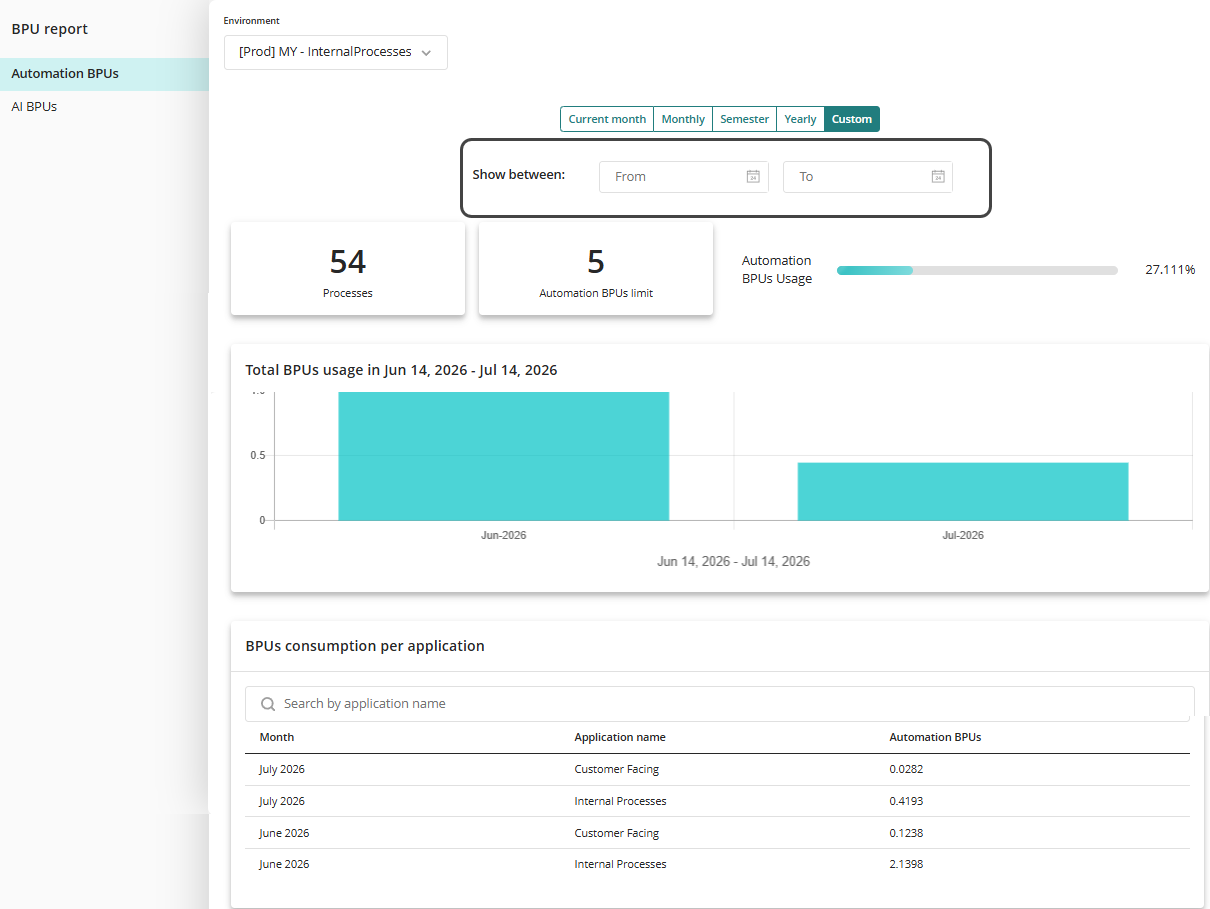
Additional features
These consumption tables offer you additional features that will make it easier for you to interpret the data they contain.
Search Filter
To filter a search in a table, select the Search by... name field and input one of the listed names of the applications/processes. If no matches are found, the table will be displayed empty.
Sort by column
Each column can be sorted in either ascending or descending order. To sort a column, simply click its header, and an arrow will appear on the right side. When the arrow points up, the column is sorted in descending order; when it points down, it’s sorted in ascending order:
•Date columns: Sorted by the most recent dates.
•Alphanumeric columns: Sorted alphabetically or numerically.
•Numeric columns: Sorted by number.
You can only sort one column at a time.

Navigation Menu
This option becomes available when the report has 10 or more records. You can adjust the number of rows displayed per page in the "Items per page" field and navigate through pages using the arrow icons.

Download Report
The report data can be exported for further analysis. For information about the available download options and generated files, see Consumption Detail Download Report.
Last Updated 7/14/2026 3:55:15 PM