Overview
In the Customer Portal you can download extensive reports of BPU consumption to Excel.
The Detail report is available in .xlsx format and includes different templates based on the type of data being reported: Automation BPU or AI BPU.
The report includes data sheets, graphs, and a constants sheet to aid in creating new charts.
Download report
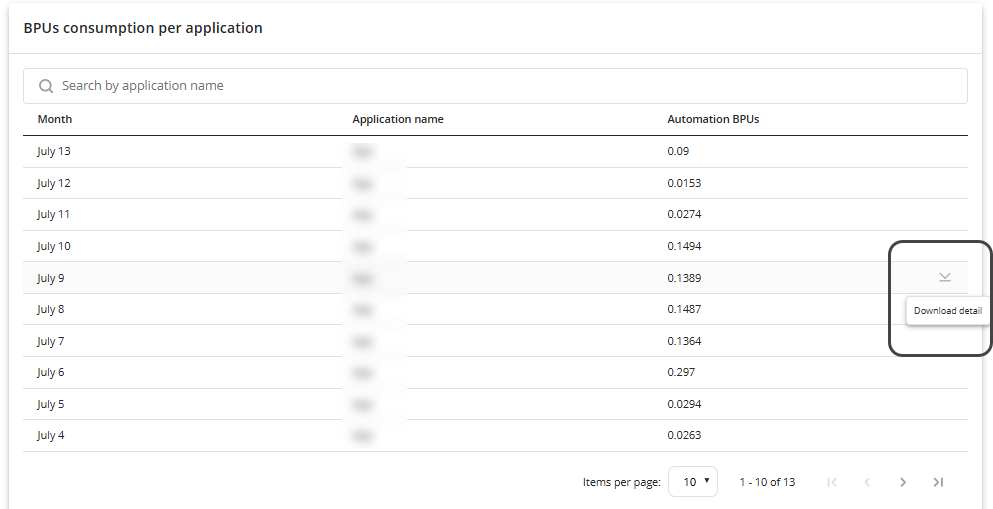
•In the Automation BPUs report, hover on the record you want to analyze, and click the small arrow that is shown at the right.
This will open a new window and prompt you with the report to be saved in the location of your choice.
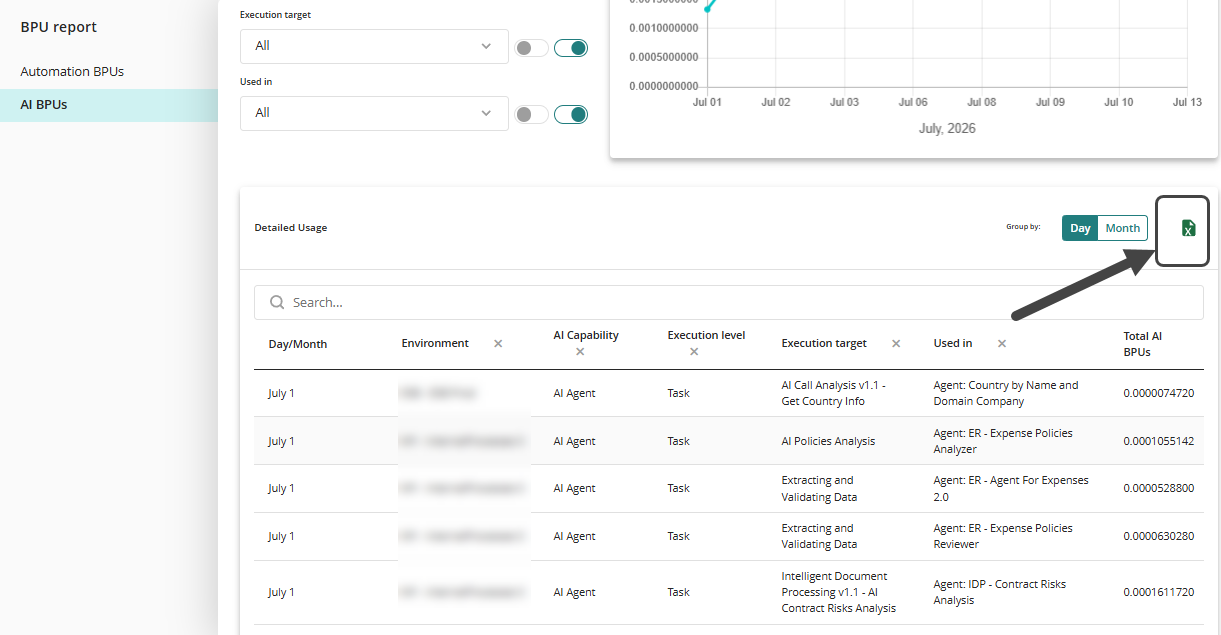
•In the AI BPUs report locate the Excel icon on top of the main table. Click the icon and the system will prompt you with the report to be saved in the location of your choice.
Automation BPU report in Excel
BPU Consumption by Applications
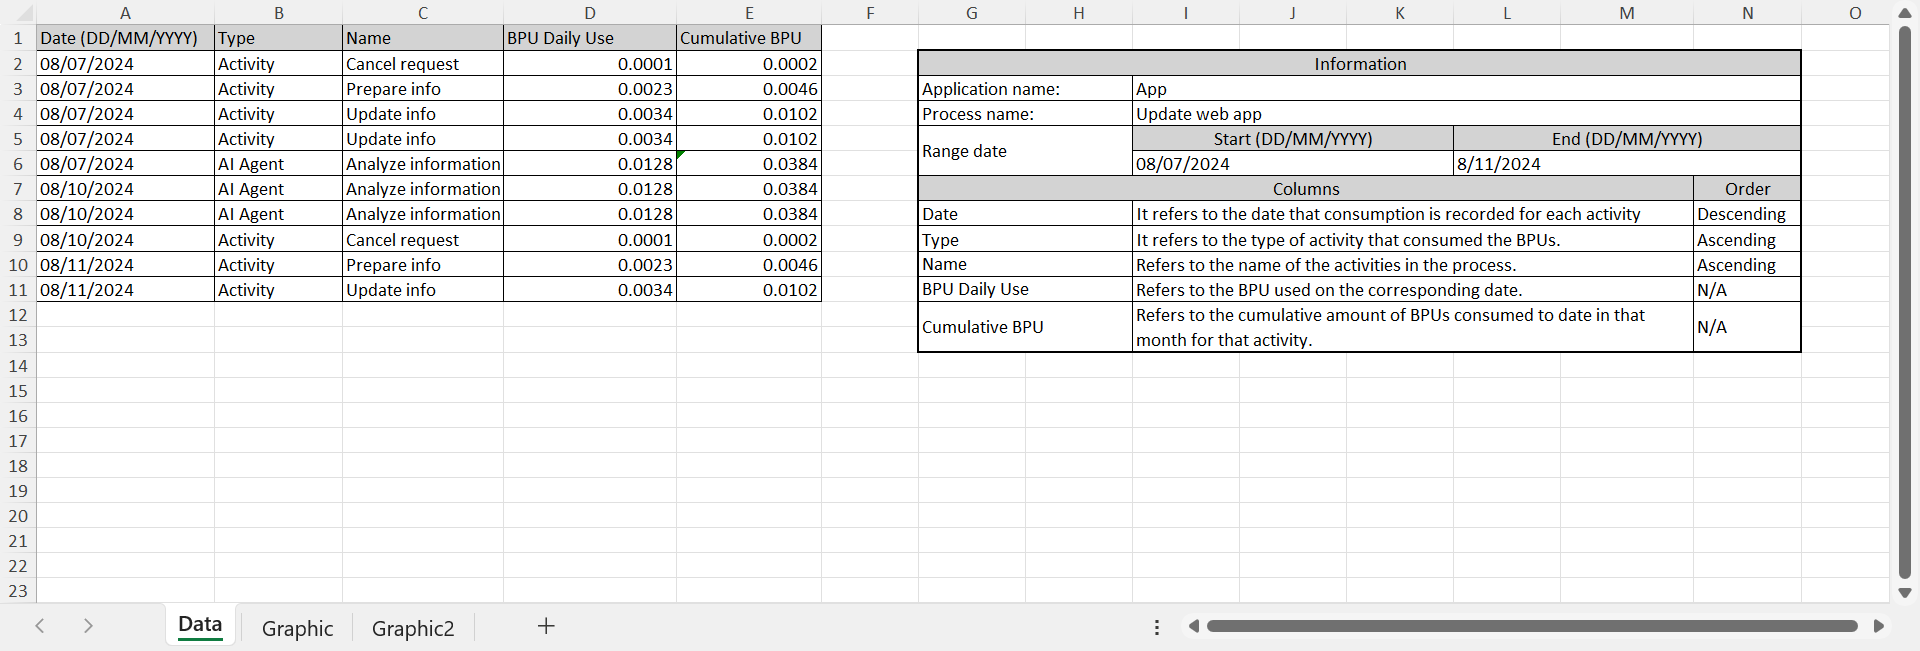
The report includes a data sheet based on the selected date range, and the report chosen (App or Process), along with graphs that illustrate the information.
There’s also a constants sheet, which can be helpful if you want to create a new chart.
The Data sheet shows two tables:
1.The Information table shows the data related to the Application like the Application name, the date range of Automation BPU consumption, and a brief description of the columns from the historical consumption table with their configured sorting order.
2.The record table has the following components:
a.Date: the date that consumption is recorded for each process.
b.Process name: Refers to the name of the processes in the application.
c.BPUs per day: It refers to the daily consumption of Automation BPUs per day.
d.Cumulative BPU: It refers to the cumulative amount of Automation BPUs consumed to date in that month for that process.
3. The Top 10 BPUs consumption preset the top 10 process of the chosen application that present the highest consumption.
4. BPUs consumption by date sheet contains a dynamic table that you can configure and customize to create their your analysis.
BPU Consumption by Processes
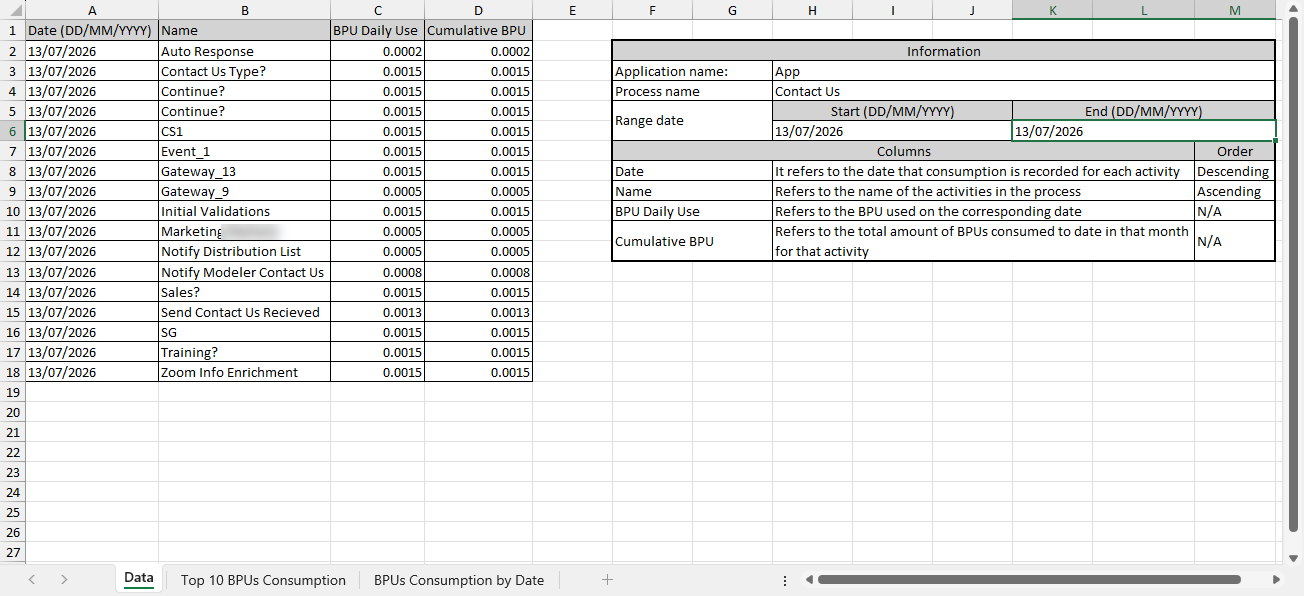
The report includes a data sheet based on the selected date range, along with graphs that illustrate the information. There’s also a constants sheet, which can be helpful if you want to create a new chart.
The Data sheet shows two tables:
1.The Information table shows the data related to the Process like the Process name, the date range of Automation BPU consumption, and a brief description of the columns from the historical consumption table with their configured sorting order.
2.The record has the following components:
a.Date: the date that consumption is recorded for each activity.
b.Name: Refers to the name of the activities in the process.
c.BPU Daily Use: Refers to the Automation BPUs used on the corresponding date.
d.Cumulative BPU: Refers to the cumulative amount of Automation BPUs consumed to date in that month for that activity.
3. The Top 10 BPUs consumption preset the top 10 tasks of the chosen process that present the highest consumption.
4. BPUs consumption by date sheet contains a dynamic table that you can configure and customize to create their your analysis.
AI BPU report in Excel
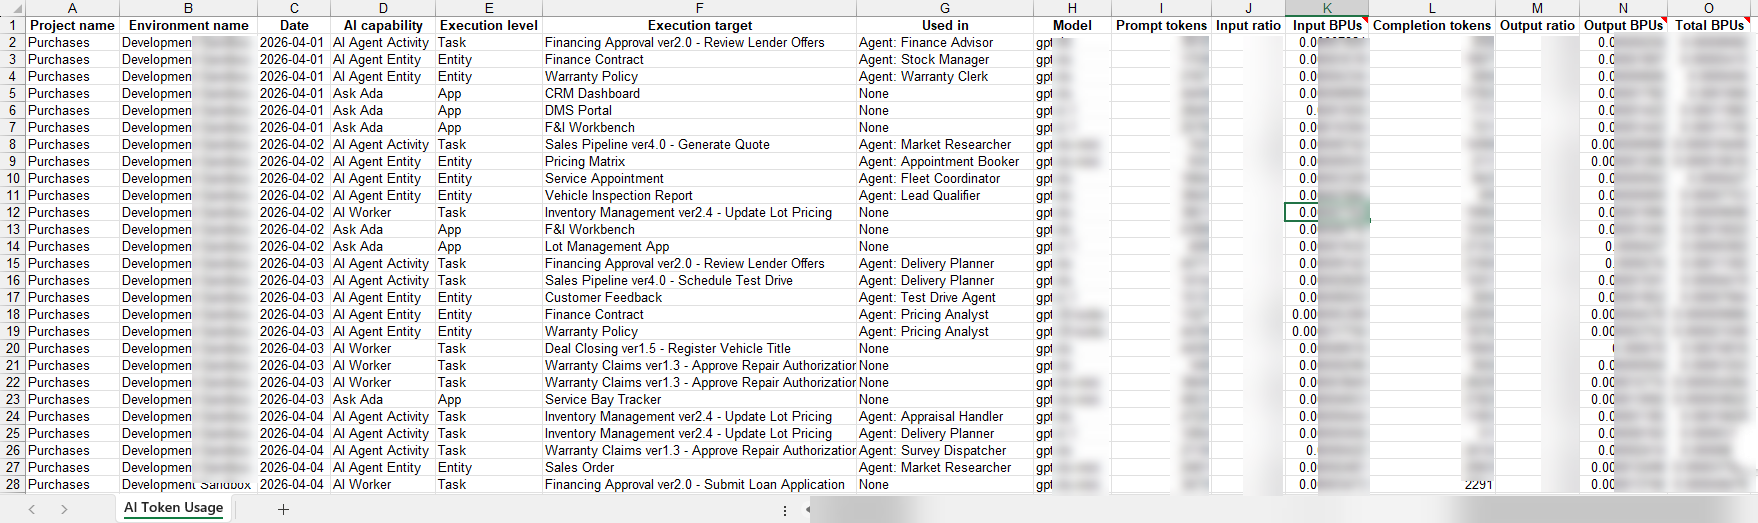
The BPU consumption report provides a complete and transparent view of how AI services are being used across all environments within a project. Every execution of every AI capability is tracked and recorded, allowing customers to understand exactly where consumption is occurring and how BPUs are being utilized.
This report is intentionally detailed because transparency is a core principle of the platform.
Rather than providing only aggregated numbers, the report displays each individual AI execution, including when it occurred, the environment where it ran, the AI capability involved, the execution target, the model used, token consumption, and the corresponding BPU usage.
The report includes activity from the environments chosen. This allows you to analyze usage patterns during implementation and testing phases and use that information to estimate future production-scale consumption with confidence.
The record table has the following components:
•Environment: The environment where the AI consumption occurred.
•AI capability: The AI feature or service that generated the consumption.
•Execution level: The level at which the AI capability was executed.
•Execution target: The specific item associated with the execution.
•Process, task, entity, or application: Additional contextual information, depending on the filters applied.
•Model details: Indicates the AI model used for the execution. Models may vary over time as we include or deprecate the ones used.
•Token usage:
oInput tokens: The number of tokens sent to the model.
oOutput tokens: The number of tokens generated by the model.
•Token ratios:
oInput token ratio: The weighting factor applied to input tokens based on the model.
oOutput token ratio: The weighting factor applied to output tokens based on the model.
•Total AI BPUs: The final AI BPU consumption recorded for the execution.
Last Updated 7/14/2026 3:14:36 PM