Overview
In the Customer Portal, you have a centralized summary of your project and its environments. Here you can review number of provisioned environments, the category of your environment, and the Bizagi version installed in each environment. Additionally, you can manage administrators of your subscription projects.
Project and environment management
Every project has information displaying the number of active environments. Under the project name you can find:
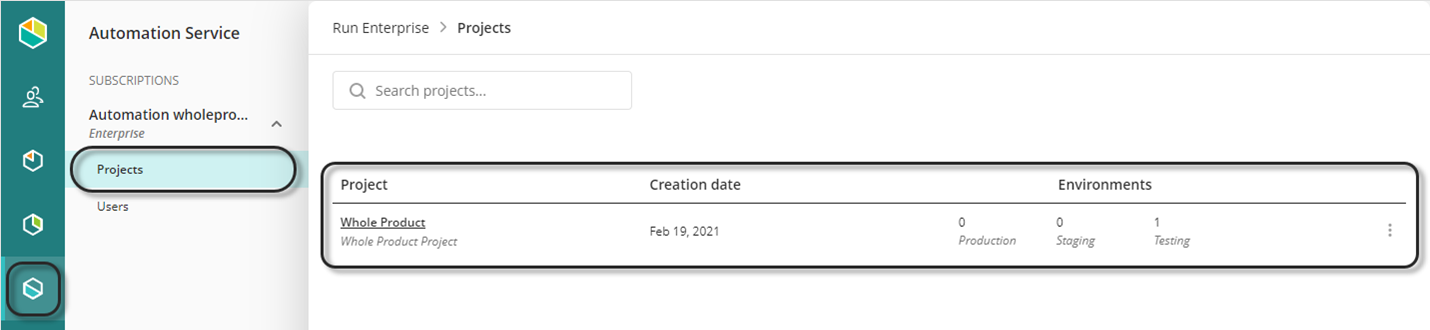
•Project active environments.
•Creation date
When you open the project information you can find all the environments, you can review the information associated with each environment:
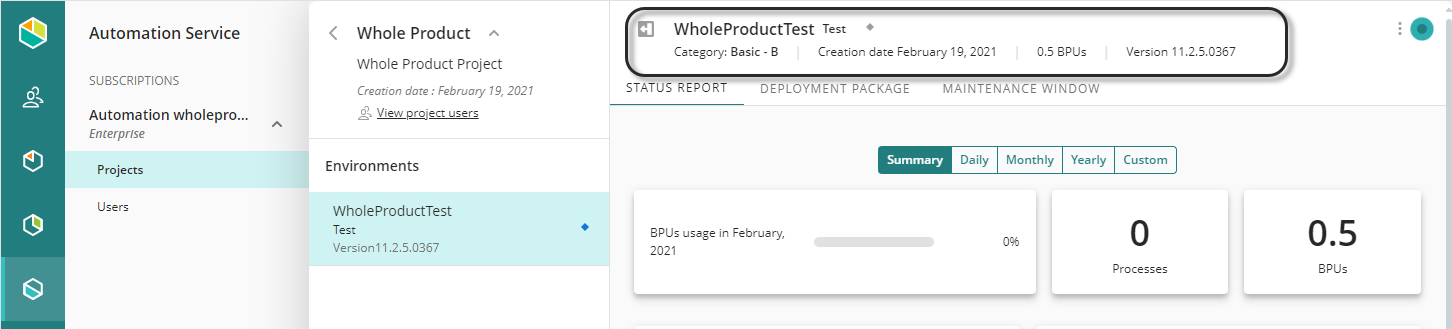
•Type of environment: Test, Staging, or Production.
•Category
•Provisioning date.
•Number of BPUs of the category.
•The version of Bizagi installed in that environment.
Options for Environments
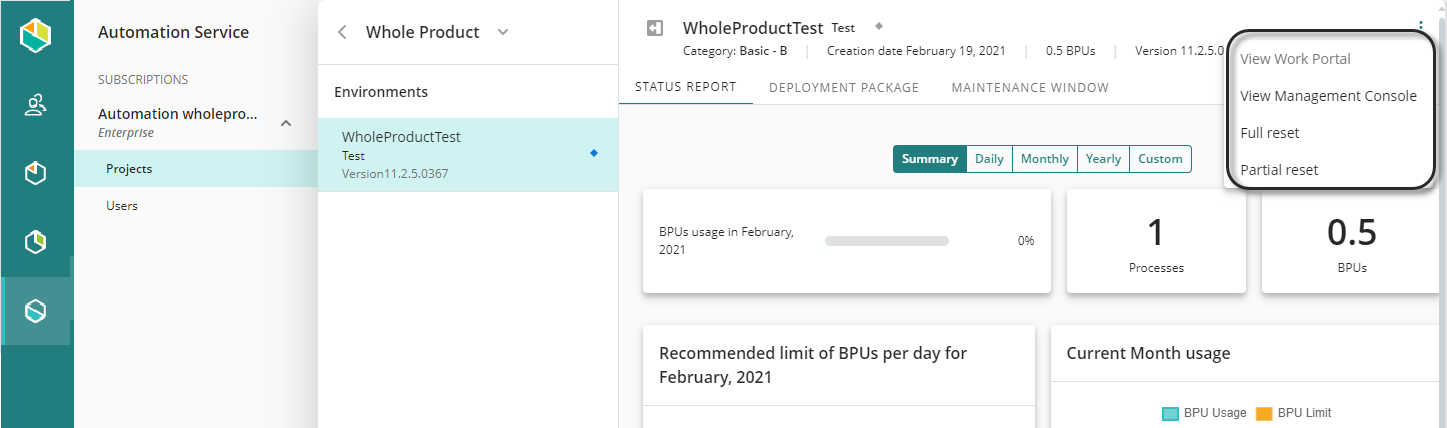
You can open any of the following options in each environment by clicking the three-dot menu on the top-right corner of the environment options:
Option |
Description |
|---|---|
View Work Portal |
Opens the environment's Work Portal in a new tab. |
View Management Console |
Opens the Management Console of the environment in a new browser tab. |
View App Designer |
Opens the App Designer of the environment in a new browser tab. |
Share environment |
Opens a window to manage permissions over the environment |
BPU report
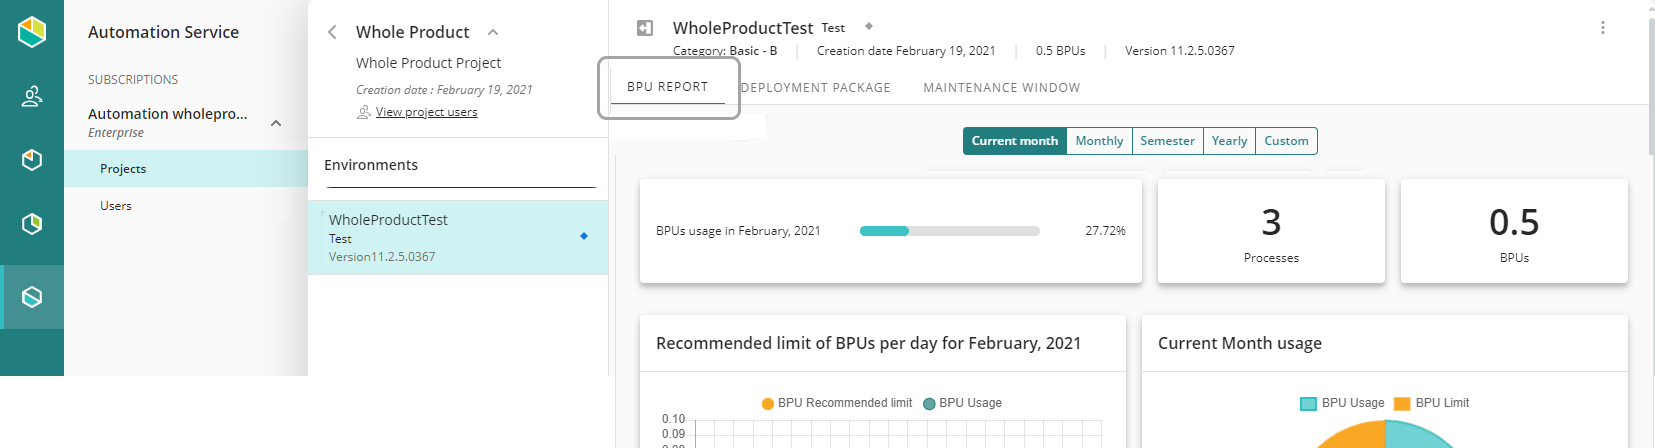
The BPU report section of the Customer Portal provides visibility into how your organization consumes the resources included in your Bizagi subscription. It helps administrators monitor usage, understand consumption trends, and make informed decisions about capacity planning.
The report is enabled for the subscription owners or contributors of the Automation service projects.
The BPU reporting experience is organized into two separate reports:
•Automation BPU report
•AI BPU report
While both reports share a similar reporting experience, they focus on different types of consumption and provide different levels of analysis.
Automation BPU report
The Automation BPU report focuses on resources consumed through business process execution within a specific environment.
Use this report to understand how Automation BPUs are being utilized by applications, processes, and activities running in your Automation Service environments.
The report includes consumption data across different time ranges, including current month, monthly, semester, yearly, and custom periods. It allows you to identify which applications or processes generate the highest consumption and helps you monitor usage against the Automation BPUs assigned to the environment.
AI BPU report
The AI BPU report provides a centralized view of Artificial Intelligence consumption across the entire company.
Unlike the Automation BPU report, which is scoped to a specific environment, the AI BPU report consolidates AI consumption from all environments associated with the organization. This provides a single place to analyze AI adoption and monitor the usage of AI-powered capabilities.
The report combines two complementary analysis areas.
•The consumption overview section presents charts and trends that help you understand how AI resources are consumed over time, compare usage against your contracted AI capacity, and identify consumption patterns or unexpected spikes.
•The consumption details section provides a detailed breakdown of the activities that generated the reported consumption. Using filters and grouping options, you can analyze usage by environment, AI capability, execution level, execution target, process, application, task, or other available dimensions.
Choosing the right report
Use the Automation BPU report when you need to analyze process execution and resource consumption within a specific environment.
Use the AI BPU report when you need to understand how Artificial Intelligence capabilities are being consumed across your organization and monitor usage against your AI subscription capacity.
For more information about the charts and options available in each view, refer to the Detailed BPU Report documentation.
Last Updated 7/14/2026 3:29:01 PM