Overview
In the following example we will build a documentation portal step by step.
Let us suppose that the Agility Corp has diagrammed and documented the following processes:
•Recruitment and selection
•Expenses report
•Help desk
•Travel request
•Access management
•Vacation leave request
•Accounts payable
•Purchase request
To communicate and share all their processes and related documentation, the Agility Corp has opted to build a documentation portal. All business processes are diagrammed in Bizagi Modeler and stored in a single .bpm file.
Click here to see the Web output of this Portal
Download here the complete Documentation portal in .bpm format
1. Defining the structure of processes
Classification and hierarchy of processes
Agility Corp concluded that the easiest and most convenient way to classify its processes would be according to the area in which they are performed. Based on this, the following classification was established:
Area |
Process |
|---|---|
Human Resources |
•Recruitment and selection •Travel Request •Vacation Leave Request |
Financial |
•Expenses report •Accounts payable |
Purchases |
•Purchase request |
IT |
•Help Desk •Access Management |
Note this gives a two-level classification; the first denotes the functional areas and the second the business processes.
The first level comprise of has four categories (each area represents a category of level 1). The second level contains eight categories (each process represents a category of level 2).
Level 0 is used to represent the highest level of hierarchy, in this case, the global view of the company.

Information of each element
In this step we have to define what information has to be displayed at which level. The Agility Corp wants different levels of information sharing:
Level 0: Company Level
•FAQ: Frequently asked questions about the company
•Manuals: Documentation on how to use the portal
•Contact information: Details of the company contact person if required.
•Help: Links to company resources.
Level 1: Areas Level
•Area description: A brief overview of the area and its functions.
•FAQ: Frequently asked questions about the area
•Manuals: Documentation setting out the structure and responsibilities of the area.
•Contact information: Details of the contact person for the area, if needed.
•Help: Links to area resources.
Level 2: Processes Level
This level will only contain the information of processes.
2. Creating the Portal in Bizagi Modeler
Now that the Agility Corp has structured its processes, we can proceed to build the Portal in Bizagi Modeler.
Creating the main page
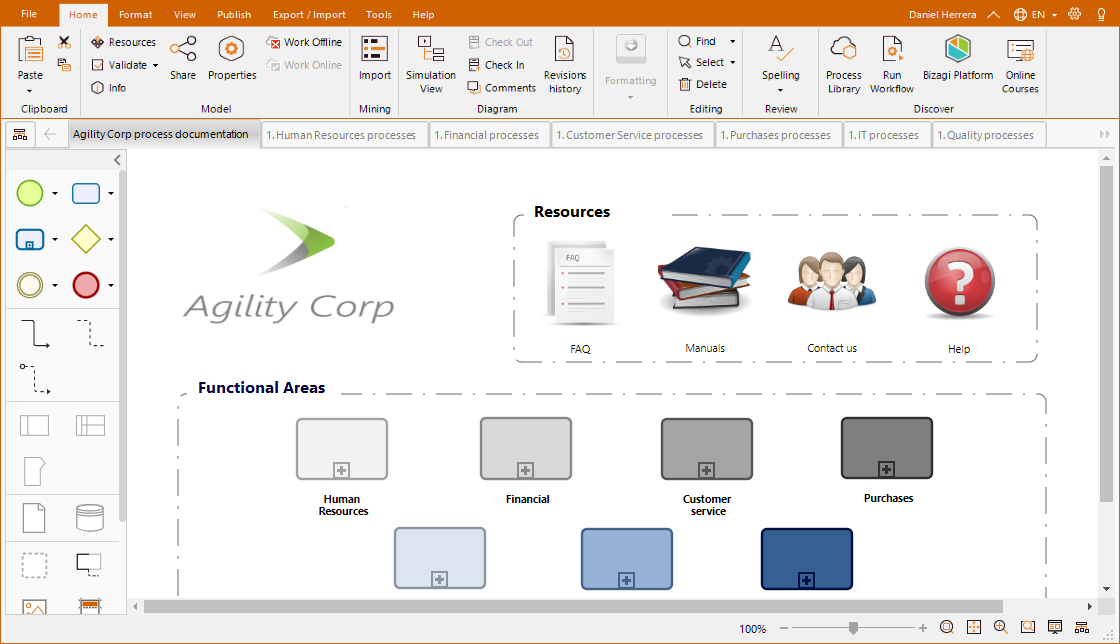
The first step is to create the page associated with the Level 0 global view (Main page). On this page, the Agility Corp wants to show the different functional areas and some general information on the organization:
•Company logo
•FAQ
•Manuals
•Contact information
•Help
The main page should look like this:
Follow the next steps to create the page:
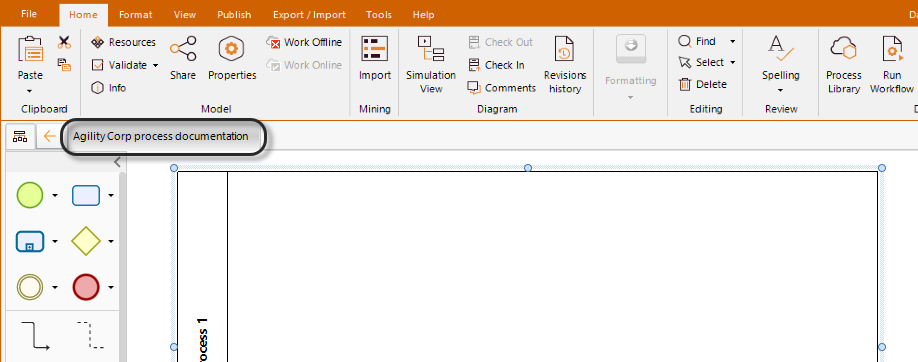
1. Create a new diagram.
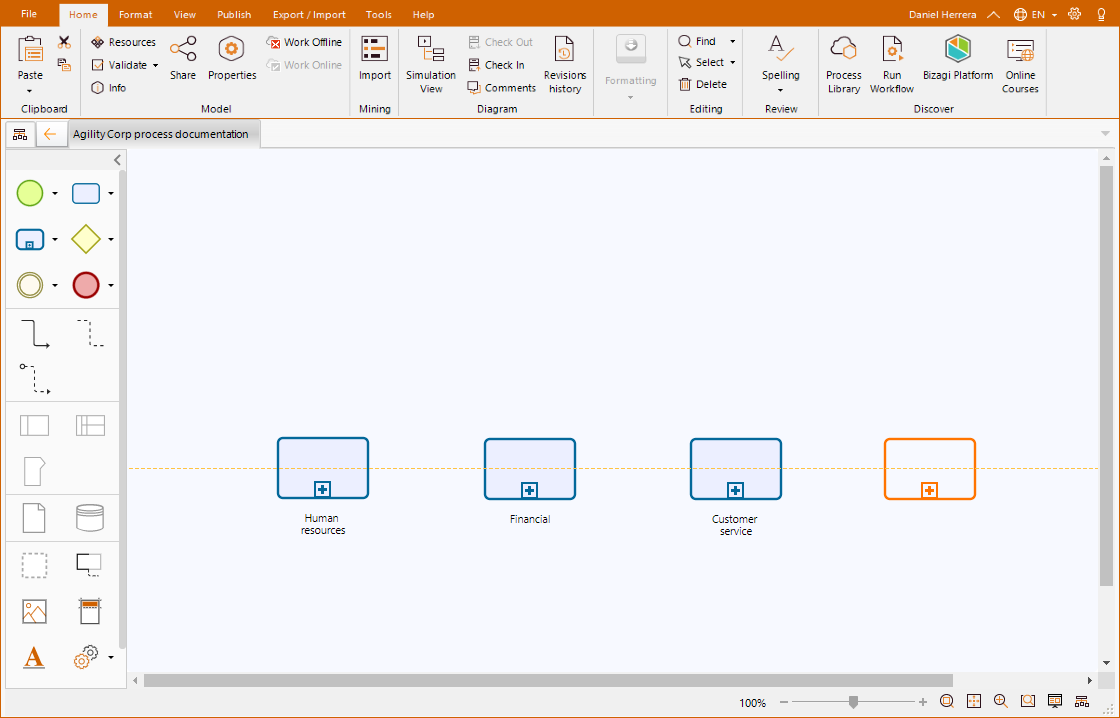
2. Remove the Pool shape and include the categories of Level 1, in this case, four sub-processes. Give each the name of the area it represents.
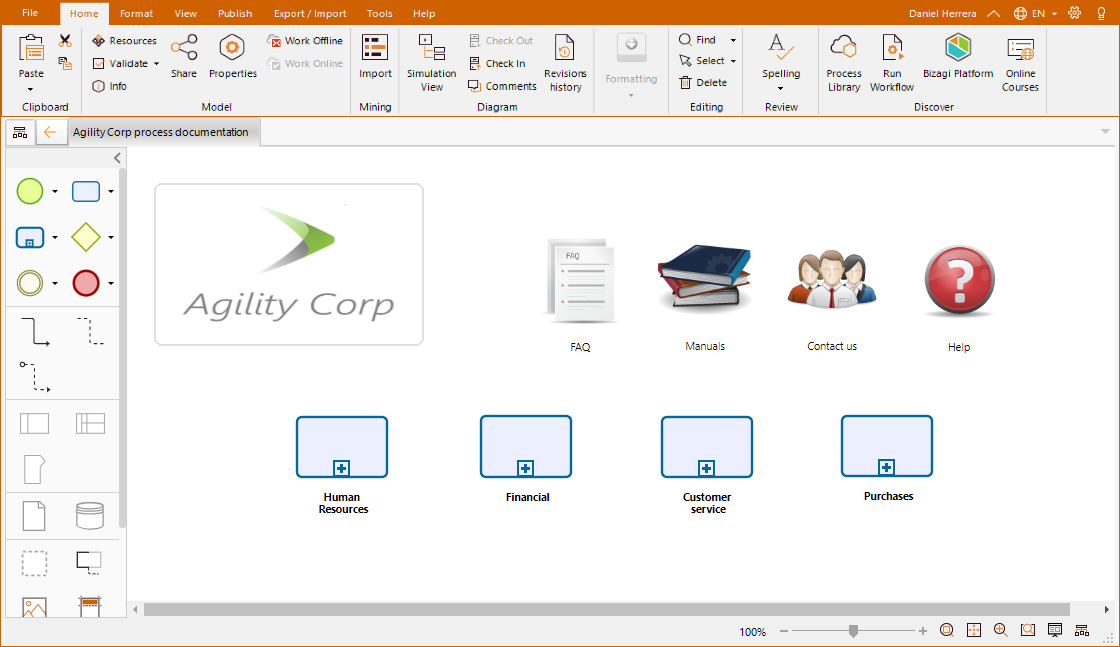
3. Use image artifacts to insert the company logo and add icons to represent the FAQs, Manuals, Contact us and Help.
4. Customize the appearance of the page using the different options and elements that Bizagi offers such as modifying shapes colors, using making use of grouping, changing font types etc.

Creating category pages
The next step is to create the level’s pages. In our example, we have two levels. As the lowest level is composed of the processes already diagrammed, we only have to create the pages associated with level 1.
As level 1 is comprises four categories, we create four pages, one for each category: Human Resources, Financial, Purchases and IT. On each page the Agility Corp wants to display the processes associated with the category (area) and the following general information about the area:
•Area description
•Company logo
•FAQ
•Manuals
•Contact information
•Help
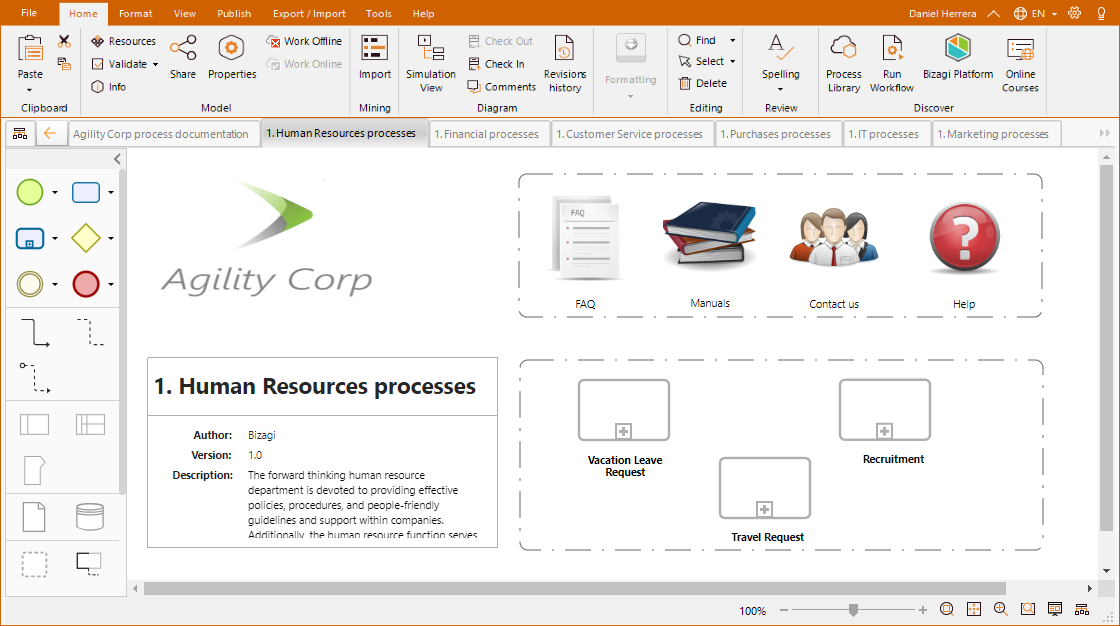
In the section bellow we illustrate how to create the page related to the Human resources category. The remaining three pages are built in the same way.
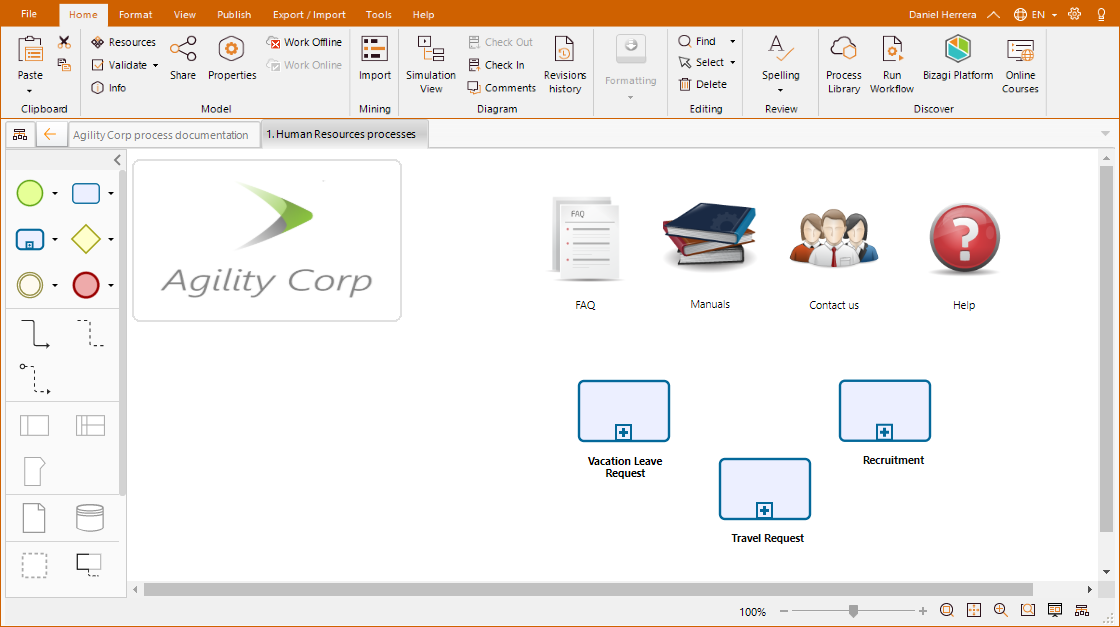
1. Create a new diagram and name it as the category. Human Resources.
It may help to include numbers or codes to more easily identify to which level the diagram belongs.
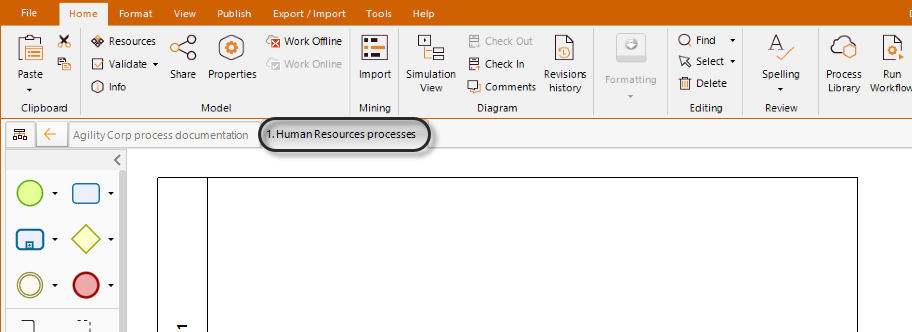
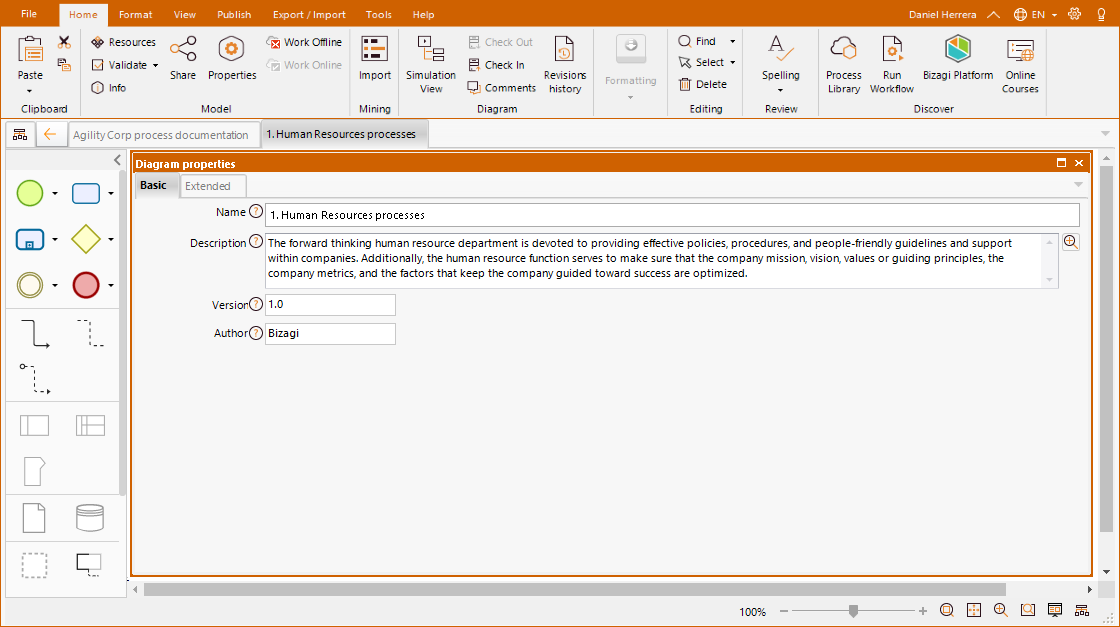
2. Right-click the diagram and open its properties. Enter a description of the area.
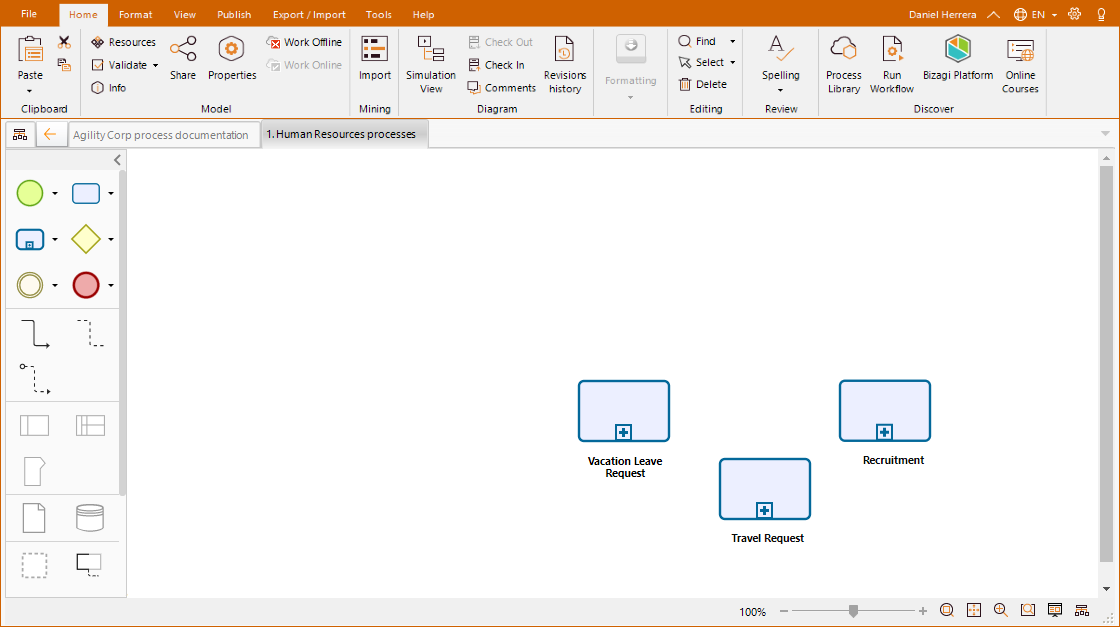
3. Remove the Pool shape and include three sub-processes to reflect categories of Level 2. Give each the name of the process it represents.
4. Use image artifacts to insert the company logo and include icons to represent the FAQs, Manuals, Contact us and Help.
5. Add a Header artifact to include information related to the area. Note the header information is the included in the diagram properties.
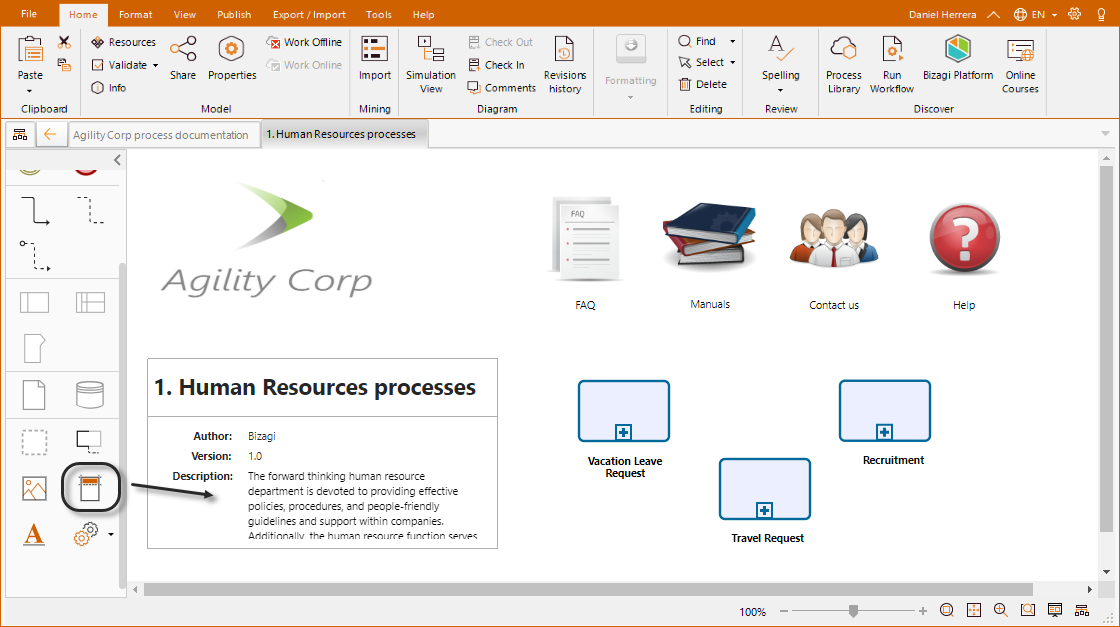
6. Customize the appearance of the menu using the different options and elements that Bizagi offers such as modifying shapes colors, using making use of grouping, changing font types etc.

Information of elements
Once the structure of the pages has been configured we can continue to define each page element will displayed upon selection.
Since we used artifacts (FAQs, Manuals, Contact and Help) we can customize the properties of these objects to show the information required.
For instance, when viewers select the Manuals element in the main page, three different manuals must display. To do that we create a table type extended attribute.
Do the following to customize the information displayed in this artifact:
1. Right-click the artifact and select properties.
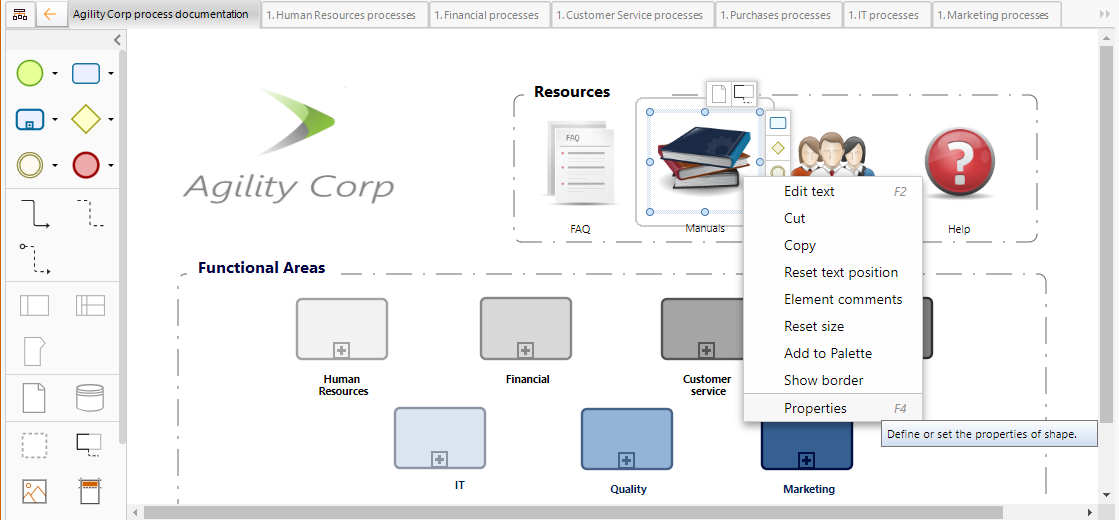
2. In the Extended tab, click Add new extended attribute
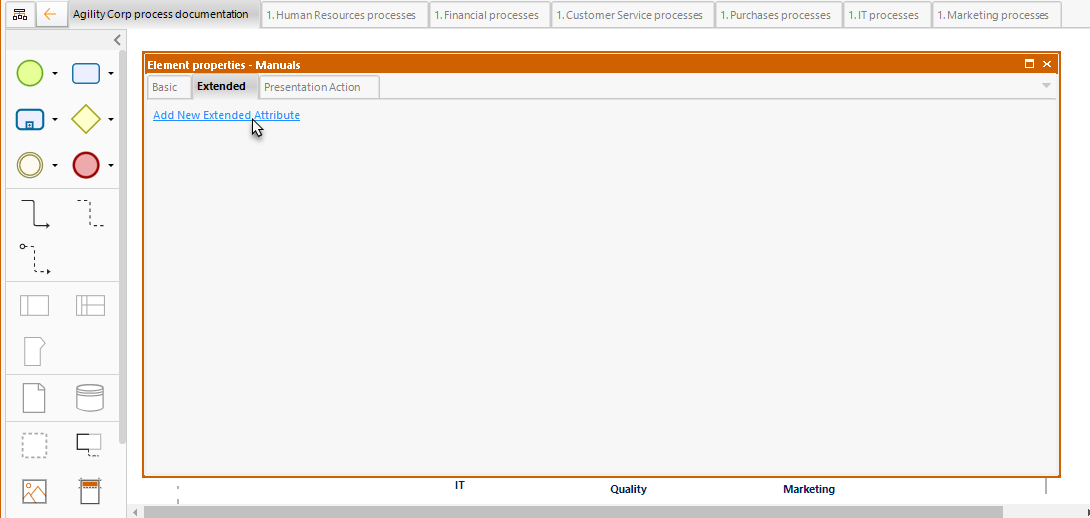
3. Assign the attribute name and description and select Table as the type.
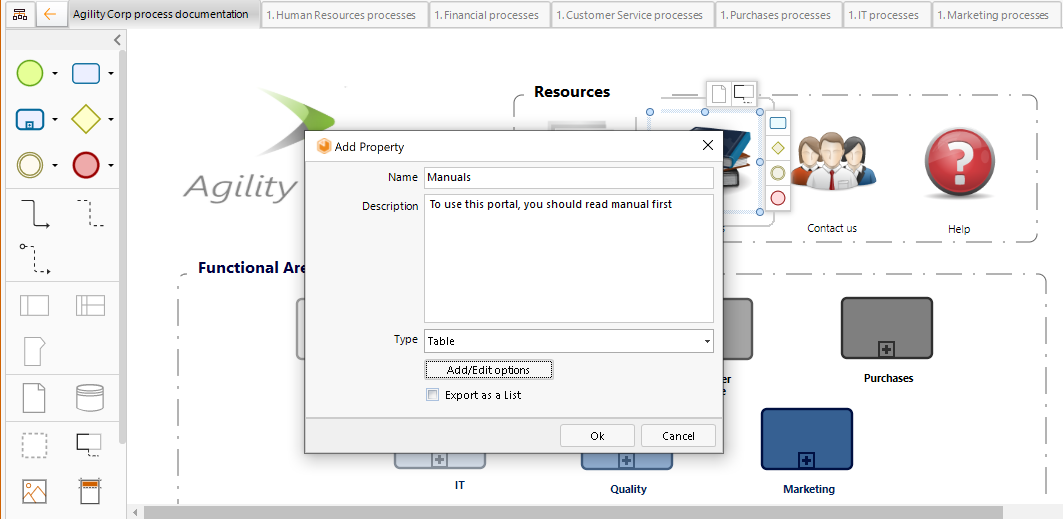
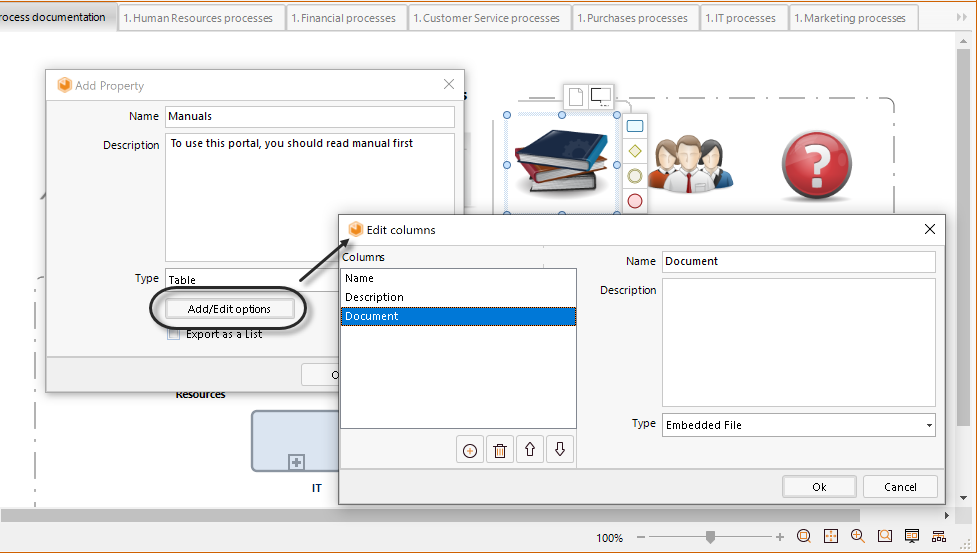
4. Define the columns to be displayed in the table. Click the Add/Edit options button and set the necessary columns.
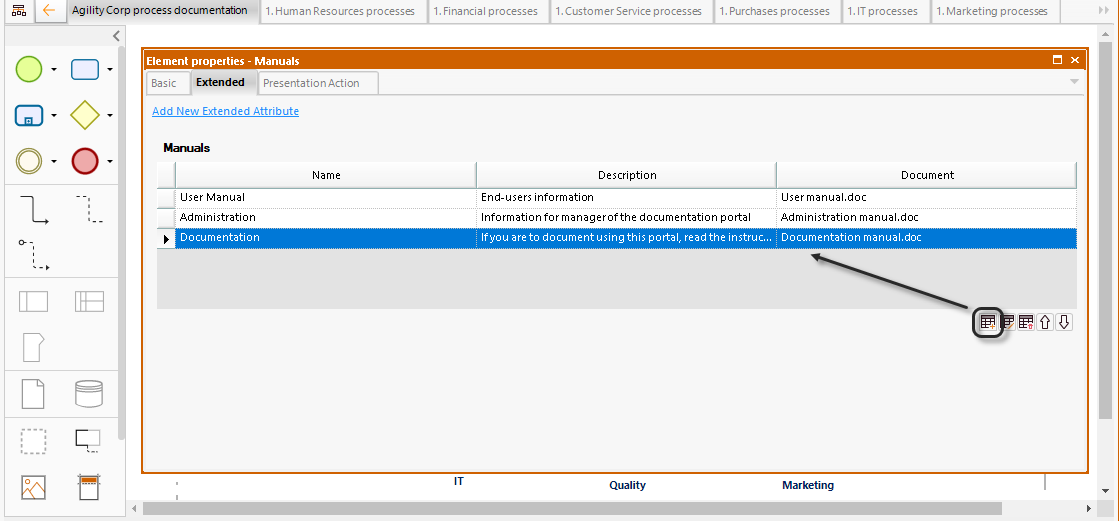
5. Next add the information to be displayed, in this case, the instruction manuals.
6. Repeat this procedure for all elements on all pages.
Linking the pages
Once all pages have been created, the next step is to link them taking into account their interrelations and hierarchy. As we saw, categories are represented by sub-processes. To connect them, these sub-processes have to be converted into reusable sub-processes. This way we can easily select the related diagram (page) from the sub-process properties.
Bellow we will connect the Main page with the functional areas pages.
1. Right-click a category (in this example an area) and convert the shape into a reusable sub-process as shown below.
The shape borders will widen.
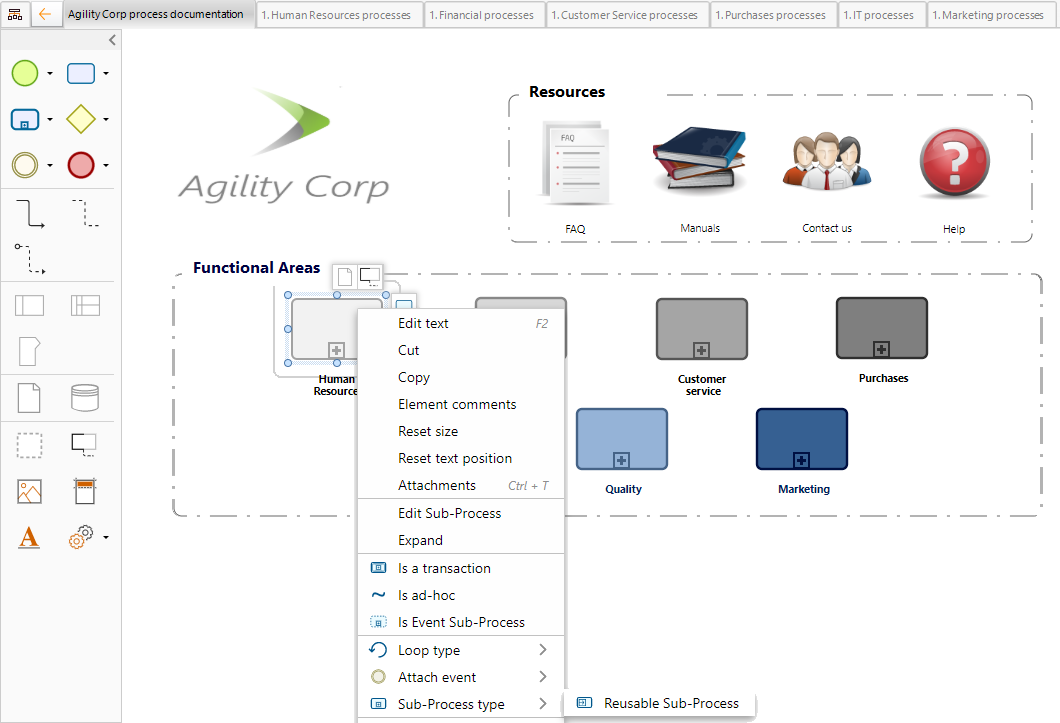
2. Right-click the category again and open its properties. From the Process field, search and select the diagram to be linked.
In this way, when users click the shape in the Process Library the associated diagram will open.
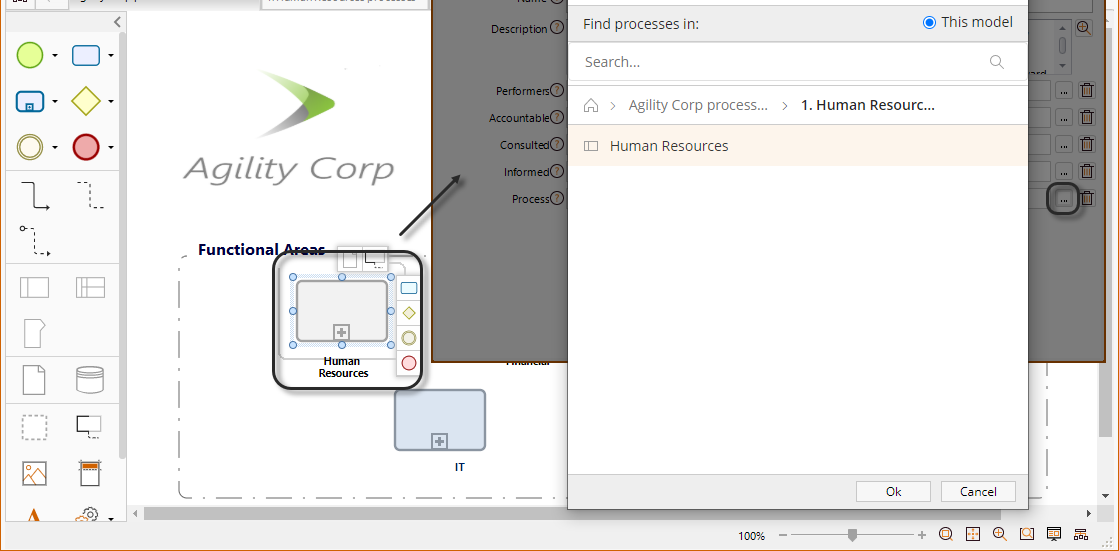
Repeat this procedure to link all the diagrams to pages in the Portal.
Save the Portal in the cloud
As publishing in web is available, the last step is save the Portal in the cloud.
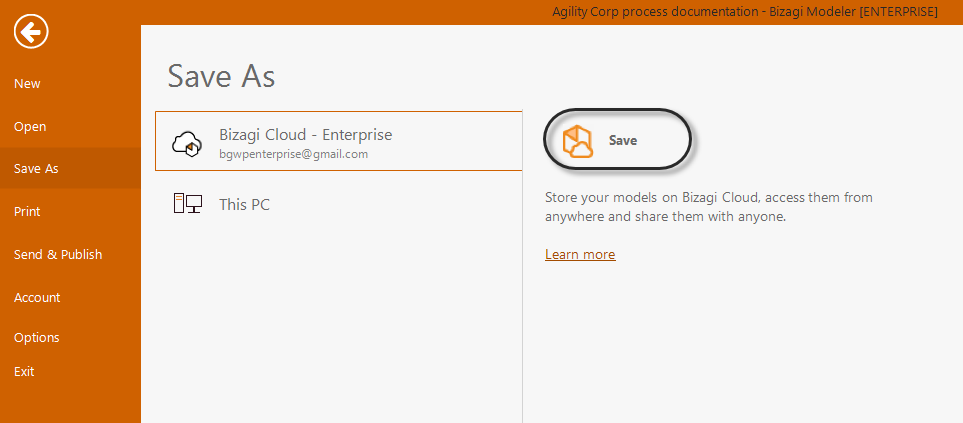
1. Click File and then, open the Save As option. Select Bizagi Cloud and click Save.
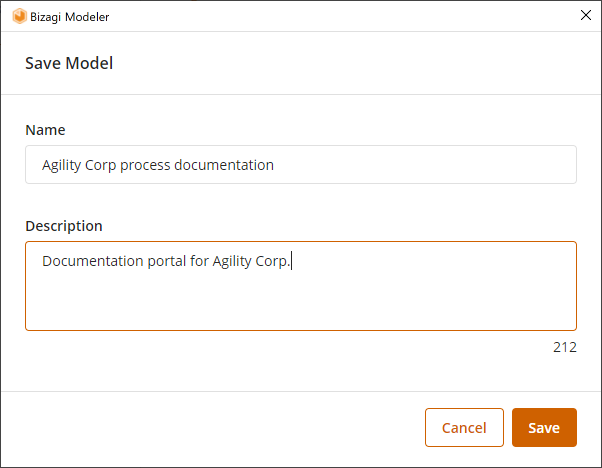
2. Provide a description of your process and click Save.
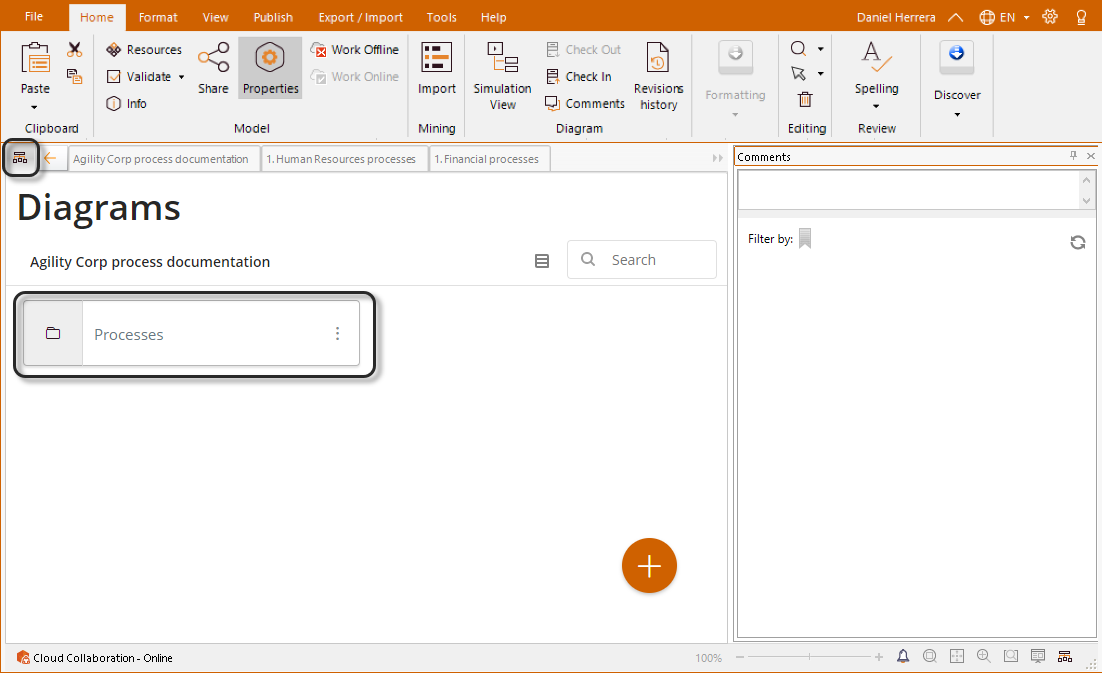
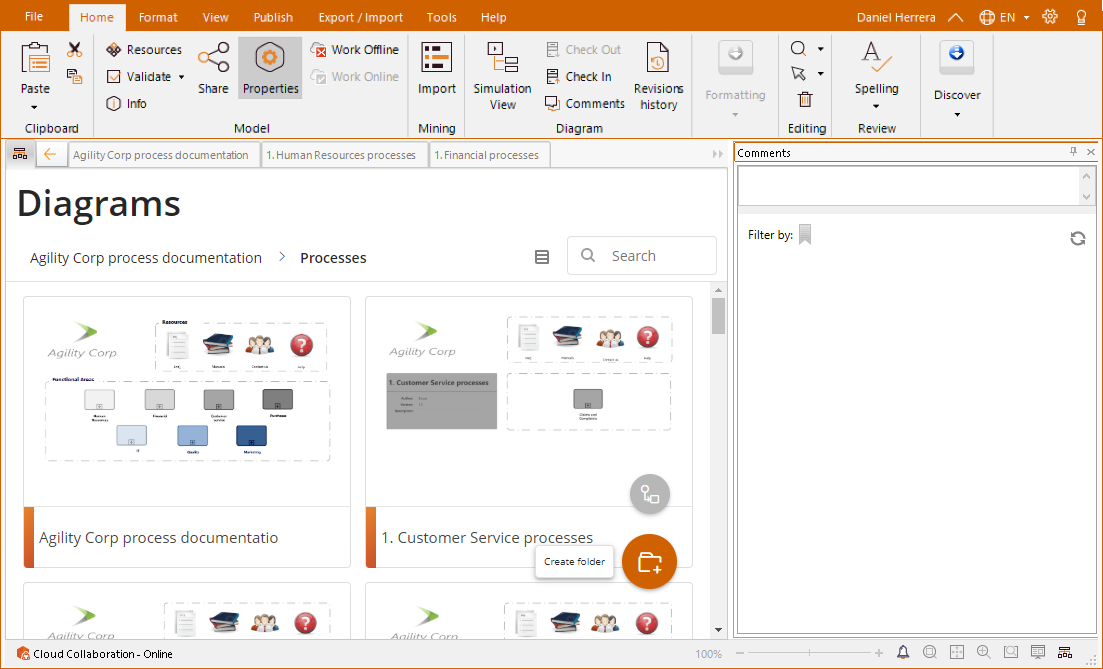
3. Once the process is saved in Bizagi Cloud, create a folder structure to organize your processes. Click Diagrams, and then, select Processes folder.
4. Create a new folder and name it as the category. Human Resources.
Click the plus icon to create a New folder.
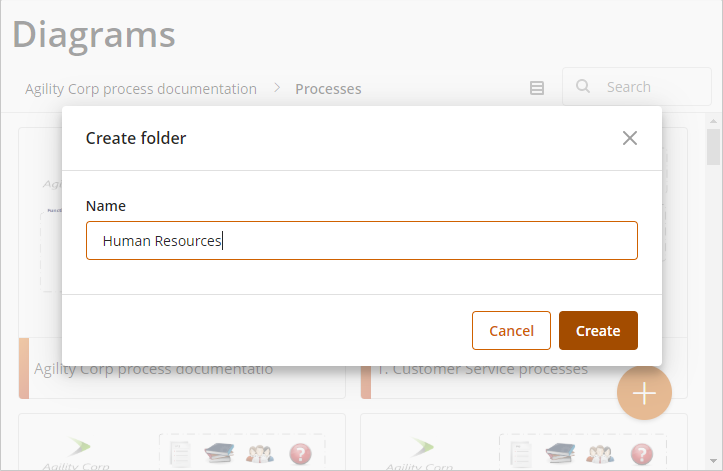
5. Provide the name for the folder as mentioned before.
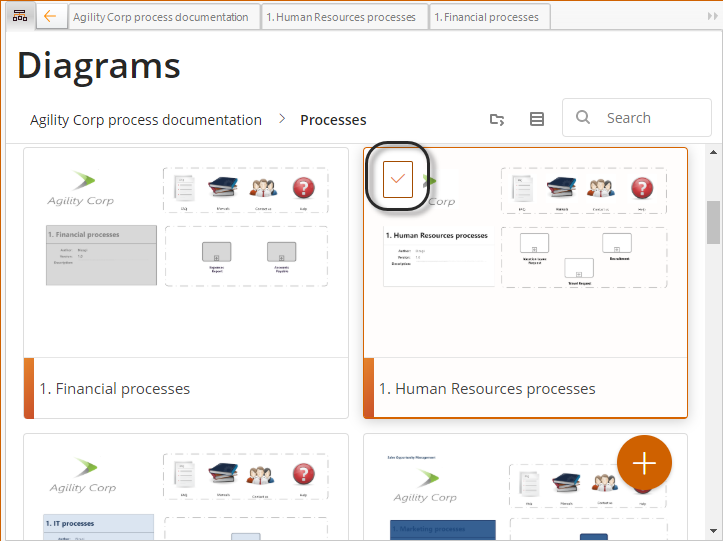
6. Select in the top right corner of the process the processes who belongs to this category: 1. Human Resources process, Vacation Leave Request, Recruitment and Travel Request.
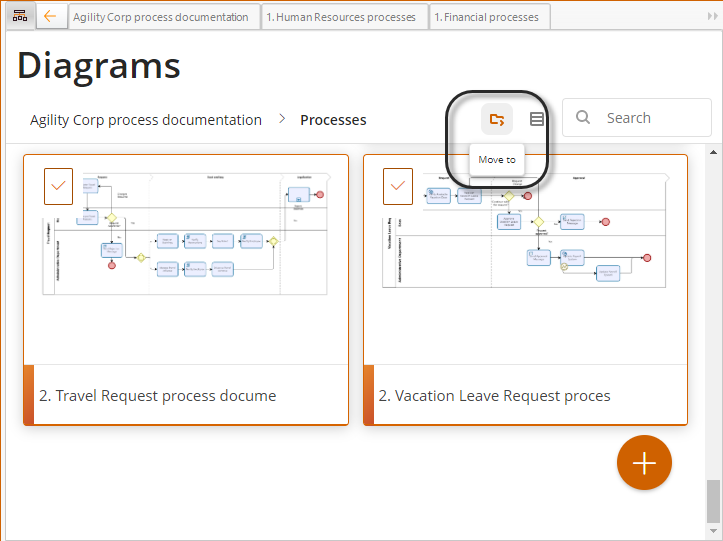
7. Select Move to option.
8. Select the recently created folder and click Move.
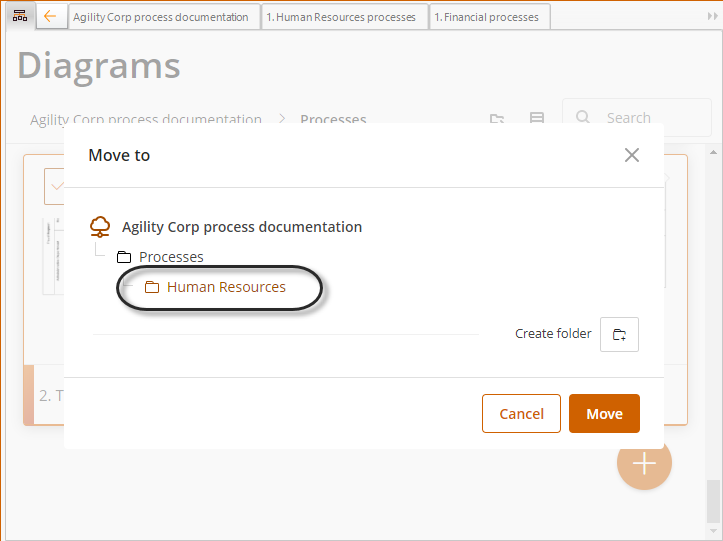
Repeat these steps for the other categories.
3. Publish the portal to web format
Once built, the Documentation Portal can be exported to the Web as a HTML file to share with other users within the organization.
To publish your Portal, do the following:
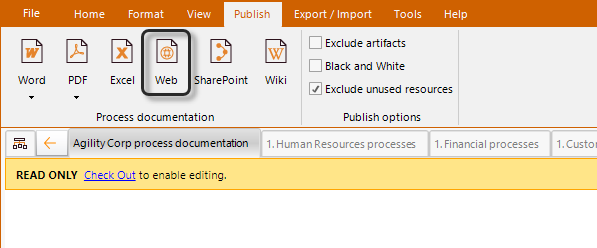
1. In the Publish tab, in the Process documentation group, click Web.
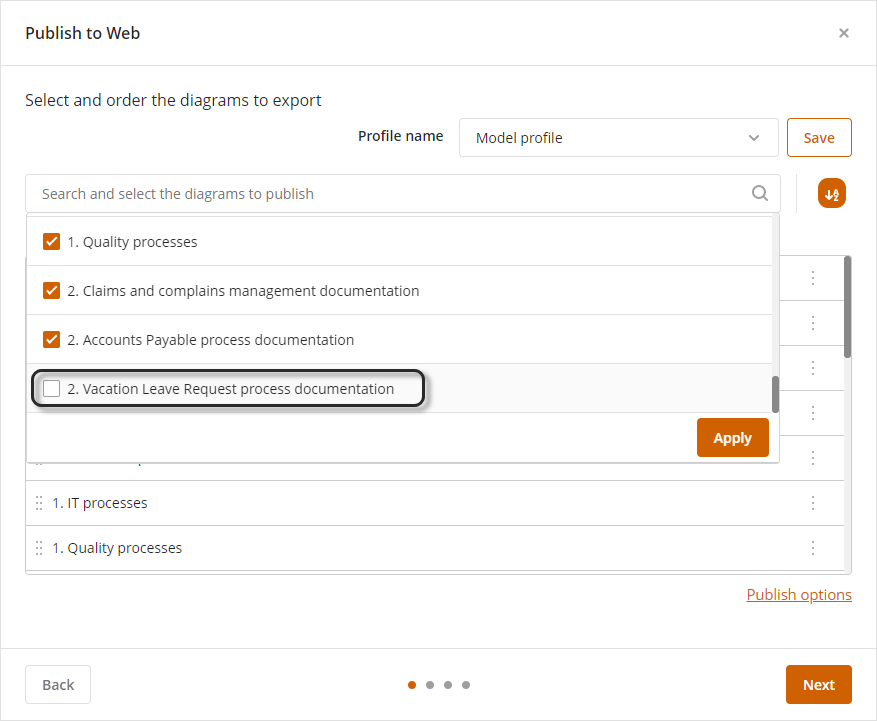
2. Select the diagrams that you wish to publish.
Select individually by checking the check box next to the name.
Select all by using the select all checkbox.
When all the diagrams you wish to publish are selected, click the Apply button.
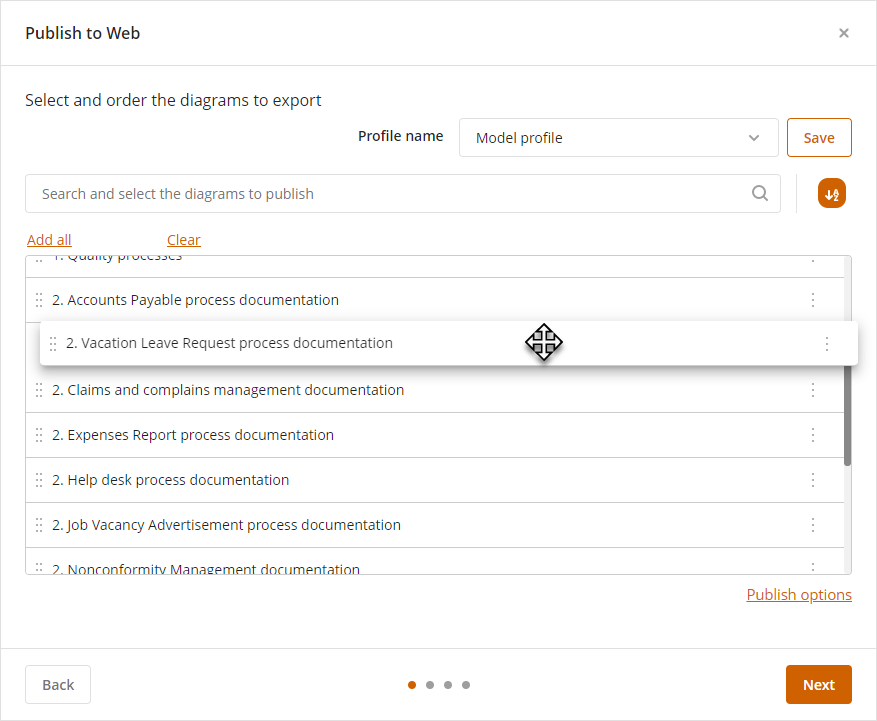
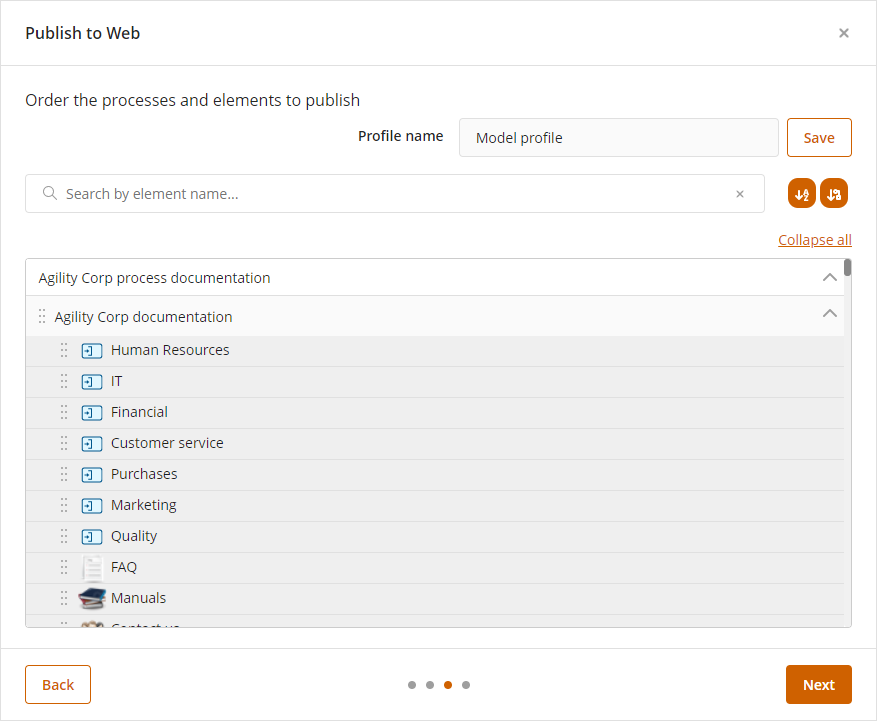
3. Choose the order in which you wish to publish your diagrams by using drag and drop features. Alternatively, you can sort them alphabetically by using the ![]() button.
button.
Once finished, click the Next button.
4. For each diagram select the elements that you wish to publish in the documentation and click Next.
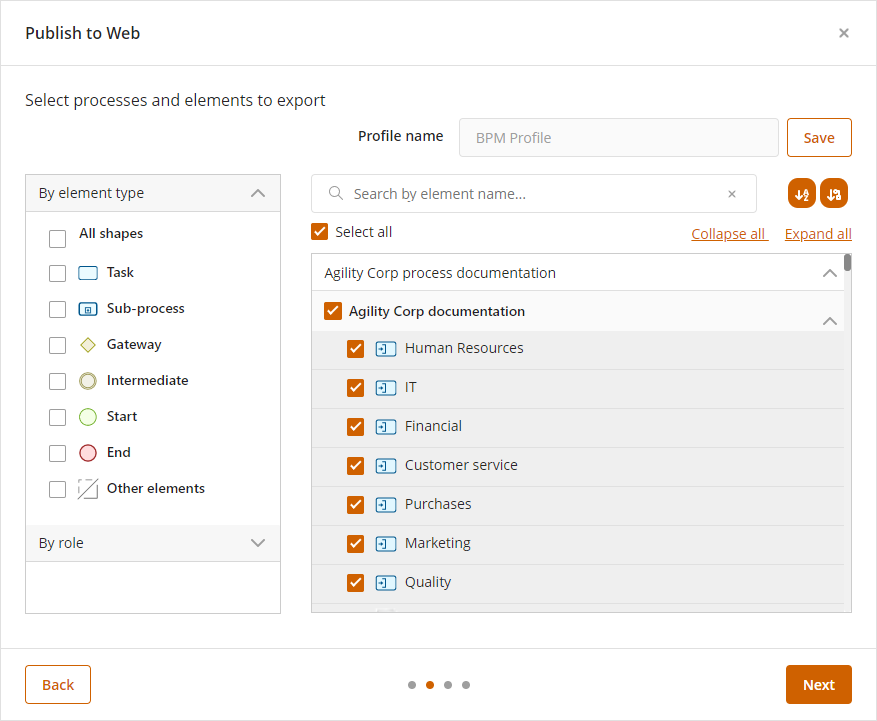
5. Specify the order in which you want to publish your processes.
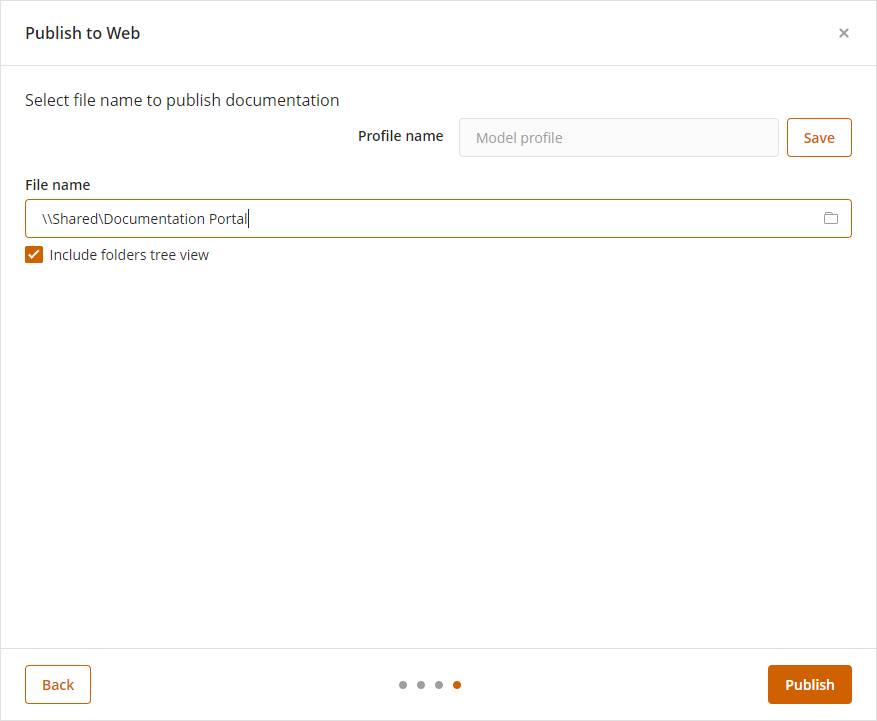
6. Specify the appropriate folder in which to publish your process. This folder should have Read and Write permissions.
Also, select the Include folders tree view option to include the folder structure previously created.
Once the process has been published on the Web, you will be able to view your Documentation Portal.
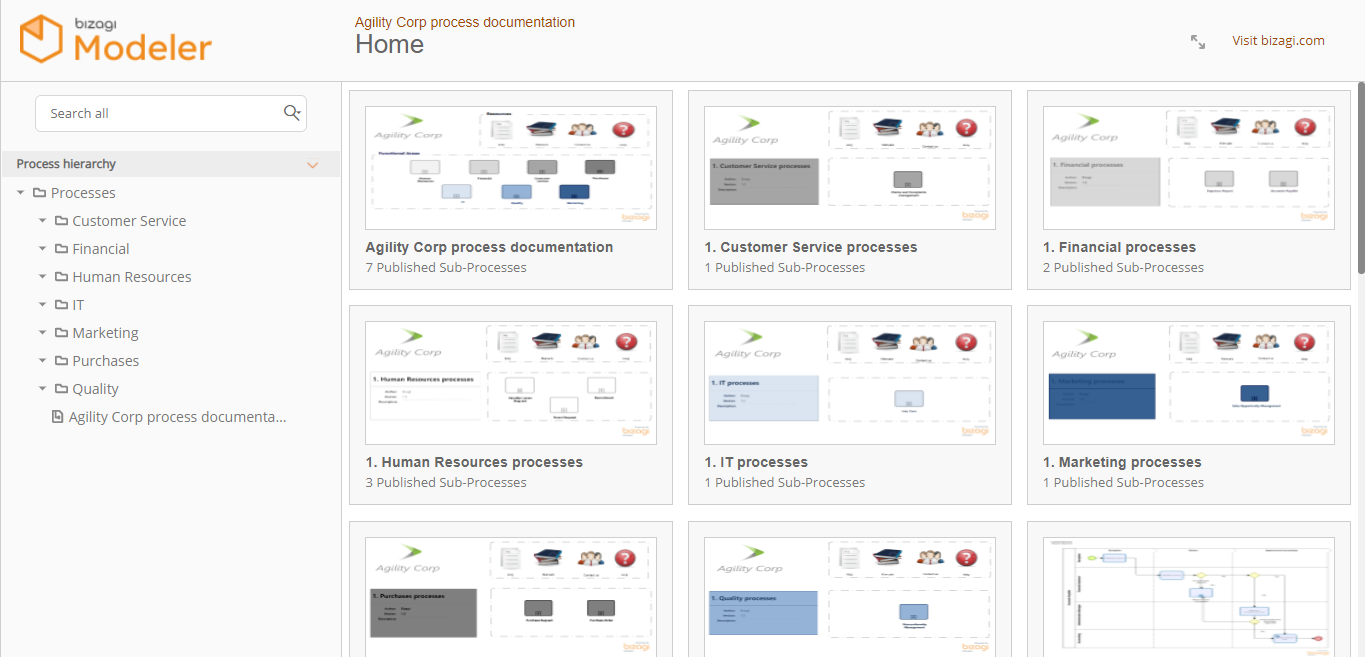
Click here to see the Web output of this Portal
Download here the complete Documentation portal in .bpm format
Last Updated 6/29/2022 12:04:47 PM