Overview
Bizagi Apps allows you to embed Power BI reports in your apps. In this way, Personas are able to visualize your automated process' data and drive better business decisions.
Before you start
Before configuring the Power BI connection in Studio, make sure you have an Azure account able to provide:
•Access to Azure Active Directory to create an Azure Active Directory tenant. By doing so, you must save your Tenant ID for latter usage.
•A service principal object, a Power BI Pro license or a Power BI Premium Per User (PPU) so you can authenticate with Power BI. When doing so, you must save your Client ID and Client secret for latter usage.
•Set up Power BI embedded. It is important to follow the Embed for your customers recommendations. Additionally, create a workspace and publish your Power BI report on it. When doing so, you must save your Work ID and Report ID for latter usage.
•Grant API permissions to avoid connectivity issues.
|
Your App Editors and your Personas (end users) do not need to sign in to Power BI or have a Power BI license. Power BI licenses are exclusively for the people creating and publishing the reports, to make them available for Bizagi Apps. |
What you need to do
To use Power BI in Bizagi Apps you need to:
1. Configure the Power BI connection in Bizagi Studio, as an external system.
3. Include the Power BI reports in the Experience Matrix for each app.
4. In the App Designer editor, configure and customize the report. To learn about how to embed the reports in Bizagi Apps, visit the Data visualization control article.
In this article, we explain how to configure the Power BI connection as a new system in Bizagi Studio, and how to configure your existing Power BI reports to be displayed in the Experience Matrix.
Power BI configuration
To establish the connection to Power BI from Bizagi Studio, follow this steps:
1.Click the Expert icon located in the Advanced section of the Home tab.

2.In the External system menu, right click the Power BI option and select New data visualization.
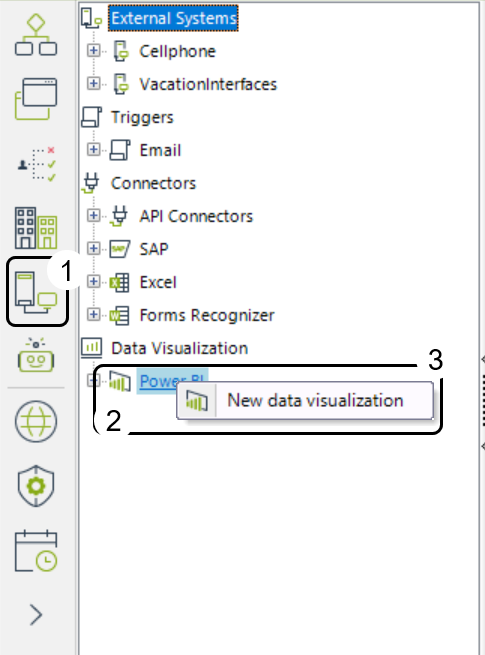
3.A new window called Power BI connection appears. The following fields are available for configuration:
•Display name: Name that will be used to identify the Power BI connection.
•Description: Descriptive text with details of the connection.
•Tenant ID: Set your own Tenant ID or Directory ID. These are found after logging in to your Azure account, and visiting portal.azure/#settings/directory.
•Environment: Select if you want to configure the connection on the Development, Test or Production environment.
•Client ID: Your own Client ID depending on the selected environment.
•Client secret: Your own Client secret depending on the selected environment.
For further information about these properties and credentials, visit Tutorial: Embed Power BI content using a sample embed for your customers' application.
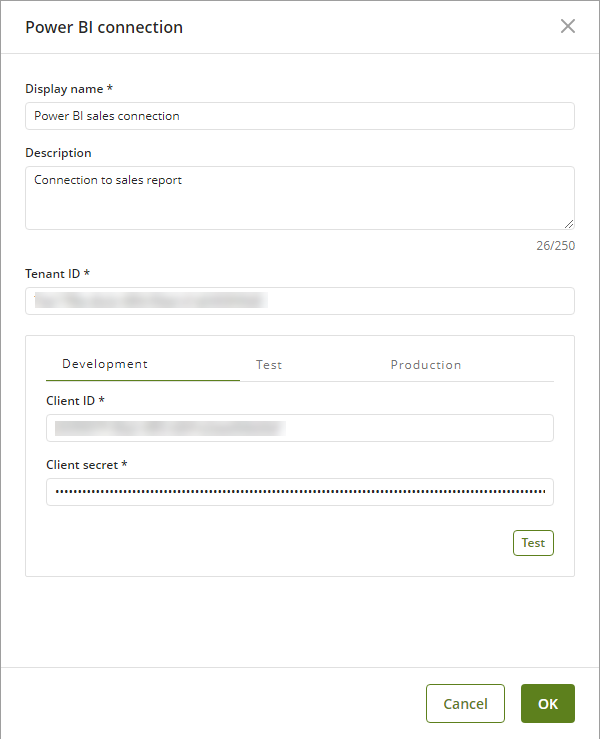
4.Click OK.
To configure Power BI reports from Bizagi Studio, follow this steps:
1.After the connection is correctly configured, right click the connection where you want to create the report and select New report.
2.A new window called Power BI report appears. The following fields are available for configuration:
•Display name: name that will be used to identify the Power BI report.
•Description: descriptive text with details of the report.
•Environment: Select if you want to configure the report on the Development, Test or Production environment.
•Work ID: after completing the Before you start steps, your Work ID can be found in the Power BI report's URL.
It should have a format similar to app.powerbi.com/groups/[WorkID]/reports/[ReportID]
•Report ID: after completing the Before you start steps, your Report ID can be found in the Power BI report's URL.
It should have a format similar to app.powerbi.com/groups/[WorkID]/reports/[ReportID]
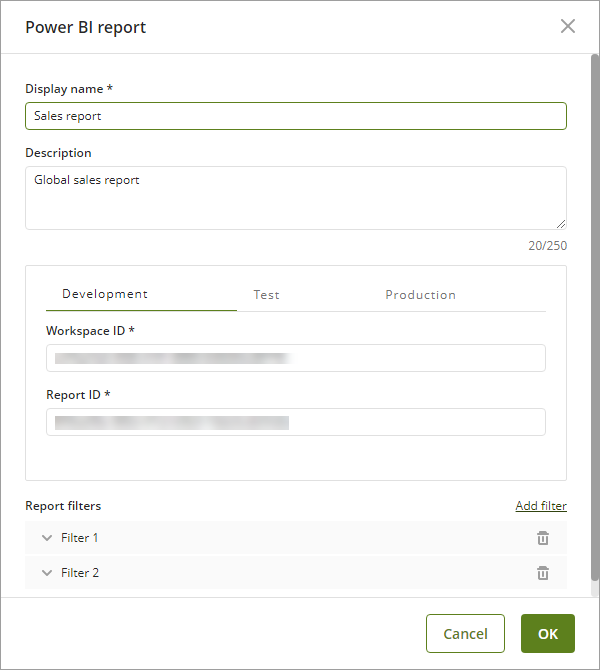
3.Click OK.
Report filters allow you to filter the data presented in your Power BI report, once you embedded it in any app from the App Designer editor.
You can add as many filters as you need. This is useful when certain data needs to be shown to a specific Persona.
As an example, assume that in a Sales Management report each Persona in your Bizagi project is in charge of certain Region across the world. In this way, you may use Report filters to match a Region column in your report. After the Report filter is configured in the Data visualization control, this filter must be applied to accomplish this goal.
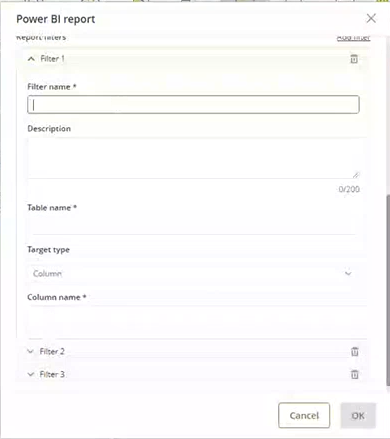
The following fields need to be set to create a filter:
•Filter name: name that will be used to identify the filter.
•Description: descriptive text with details of the report filter. We highly recommend to include information such as the possible fields that the filter would accept or what is the expected behavior.
•Table name: name of the Power BI table that has the information to filter.
•Target type: decide whether the filter will use a Column or a Measure.
•Column / Measure name: name of the Column or a Measure that has the information to filter. It changes depending on your Target type selection.
Using Reports in the Experience Matrix
Once you have configured the Reports to be used in you project, you can add them in the Experience Matrix to relate them to the Personas you want.
Relate a Report to a Persona
In the Experience Matrix, to relate a Report to a specific Persona you will need to show the Reports. To do so, check the Show reports checkbox as shown in the image below.
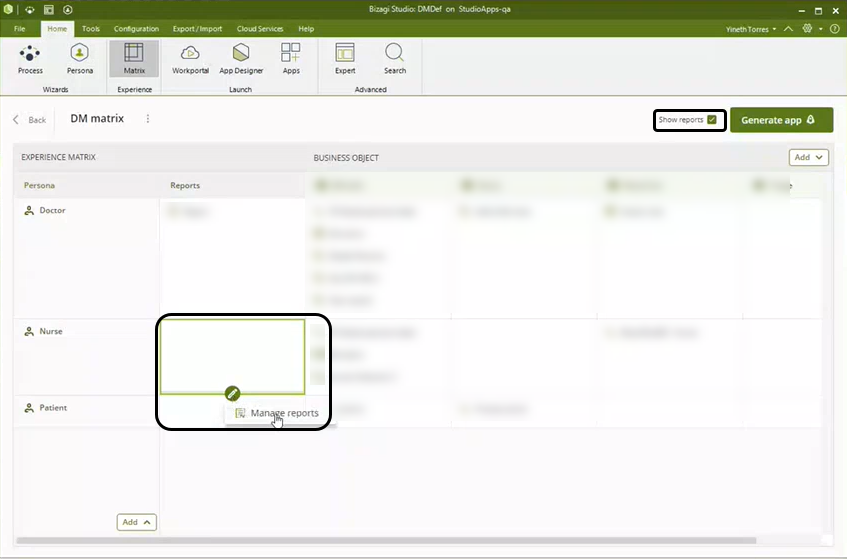
Then, in the Reports column, select the intersection for the Persona you want to relate the Report using the Manage reports button.
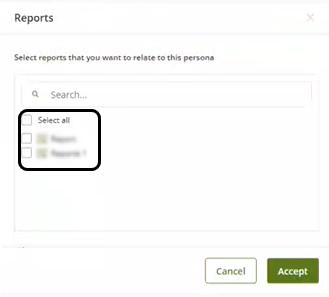
A new window called Reports appears. From there, you can select the Reports you want to relate to that Persona, or deselect the ones that you want to remove from that Persona.
Last Updated 11/14/2024 2:36:00 PM