Overview
In addition to the resources constrains discussed in the previous level, we should also consider the effect of resources availability over time to obtain a better understanding of true process performance.
In real scenarios, processes are subjected to ever changing conditions in the availability of resources. Holidays, weekends, shifts and breaks restrict and define the true performance of a process.
This level predicts how a process will perform during dynamic periods of time, such as shifts, days schedules or weeks.
At the end of this level you will obtain more accurate information on:
•Sub- or over-utilization of resources.
•Total resources costs.
•Total activity costs.
•Delays (time an activity waits for a resource).
•Expected cycle time.
Defining the input data required for this level
Additional to the information required in the previous level, the following must be defined in the Calendar Analysis:
Calendars
A Calendar defines resource capacity over certain periods of times. They define the schedules, shifts, holidays and other time constraints to reflect the process in real life.
To create a Calendar click the Calendars option. Click Add calendar.
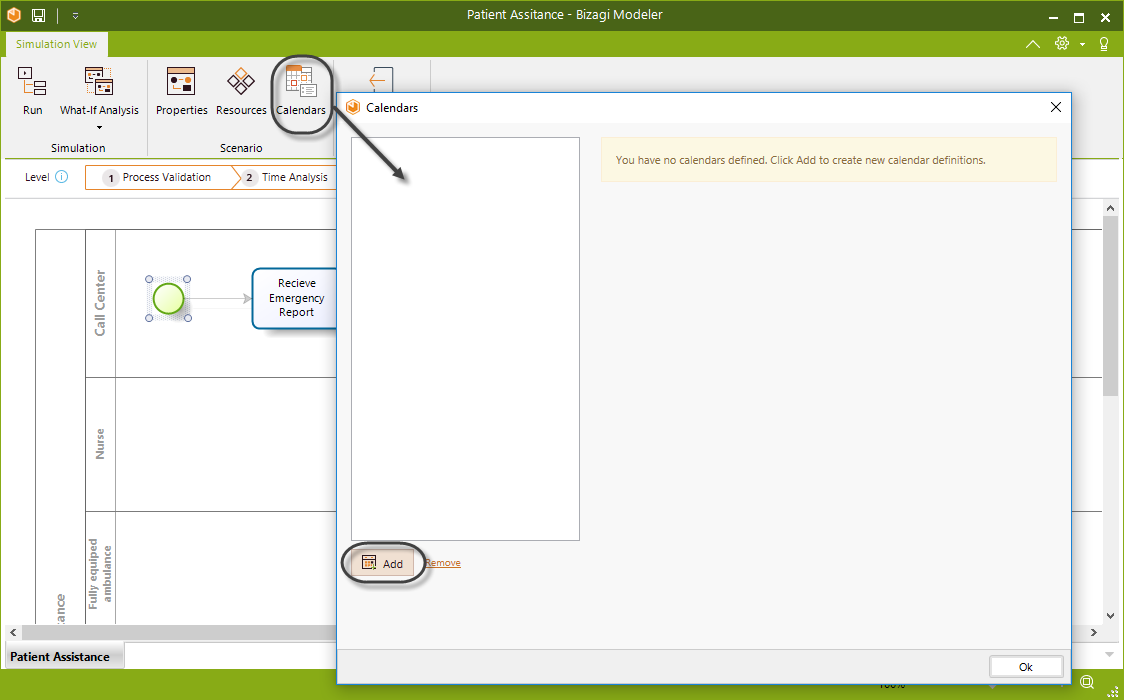
Defining a Calendar is done in the same way as Outlook. Thus, you can configure time shifts or longer periods of time.
In the Calendar configuration you find the following options:
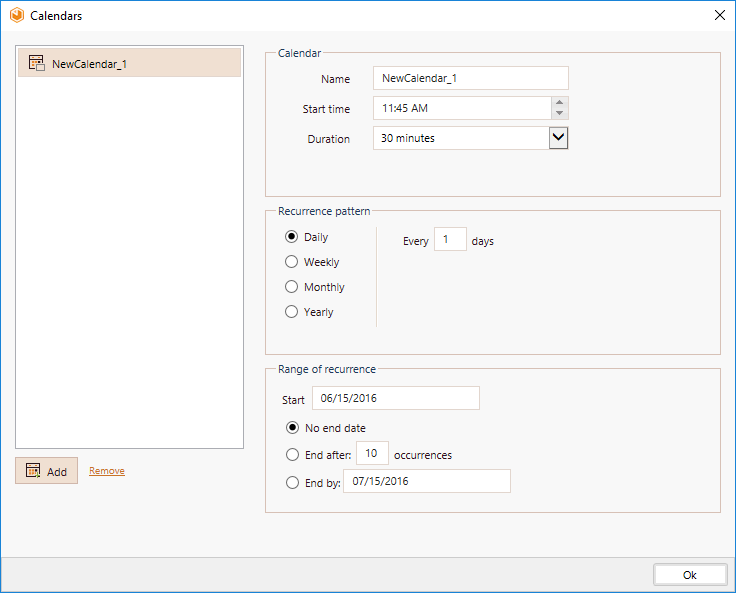
•Name: Defines the name of the calendar. It should be short and clear in order to allow identifying the period of time it represents. For example night shift, coffee break, lunch hour etc.
•Start Time: Defines the starting time of the calendar.
•Duration: Defines the total duration of the calendar.
•Recurrence Pattern: Defines the frequency with which a Calendar will be repeated. It can be daily, weekly, monthly or yearly.
•Range of recurrence: Defines the period of time for which the calendar applies.
•Start of recurrence: Defines start date of the period of time for which the calendar applies.
•End of recurrence Defines the end date of the period of time in which the calendar applies. It can also be defined in terms of number of recurrences.
Click OK to save the changes.
Calendars assignment
Additionally in this level, you have to define the availability of resources for each defined calendar.
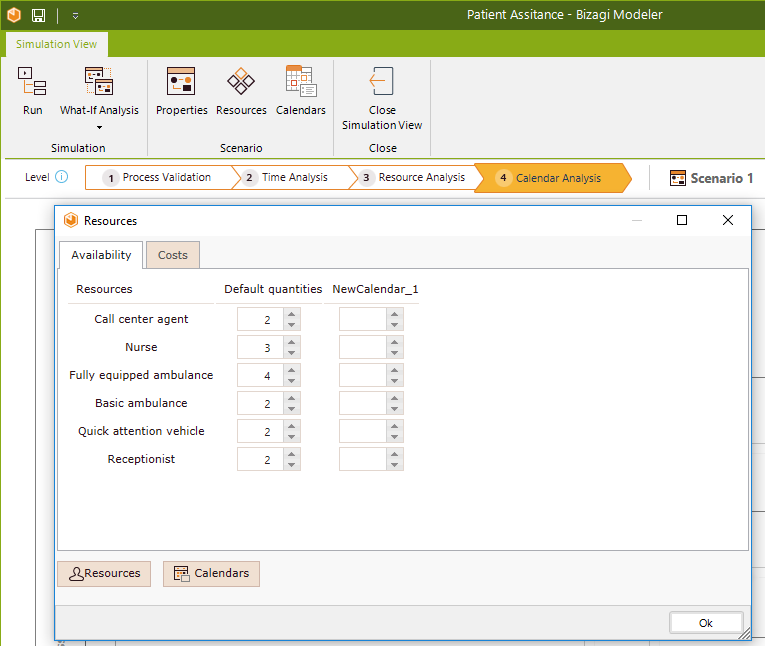
To define the calendars assignment click the Resources option
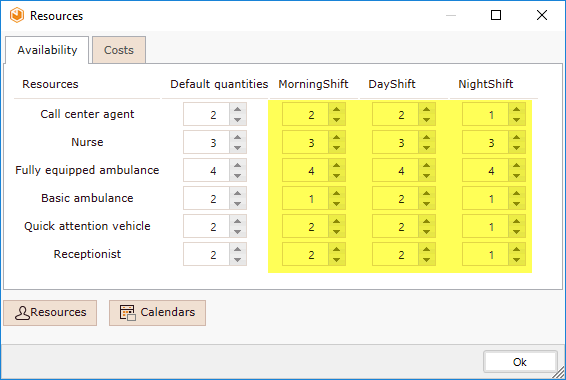
For each Resource (row) you must define the availability for each calendar (column).
Keep in mind that if you leave a Calendar blank, Bizagi will assume the availability value of a resource is the one defined in the Default Calendar.
This calendar includes the same resources availability defined in Level 3 (Resources Analysis).
Running the simulation
Once the required data for this level have been defined, click the Run button to execute the simulation.

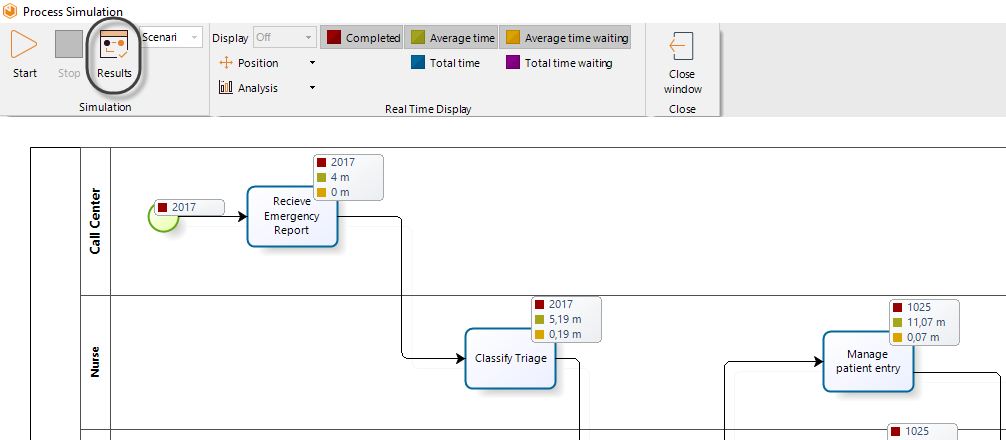
In the new window, click Start to run the simulation.
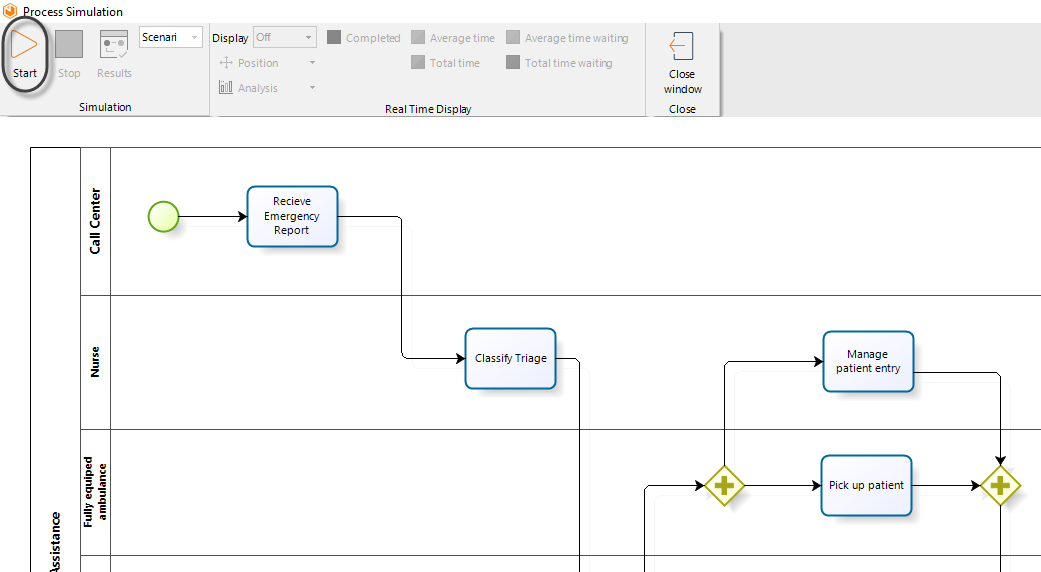
When running a simulation, the following analysis data will display.
•Status of resource usage
•Number of tokens completed
•Average time per activity
•Total processing time for each activity
•Average waiting time for each activity
Results
When the simulation is complete, select Results to view the outcome. For a calendar analysis , the results of the simulated outcome will contain the following information:
Tab for Process and Activities
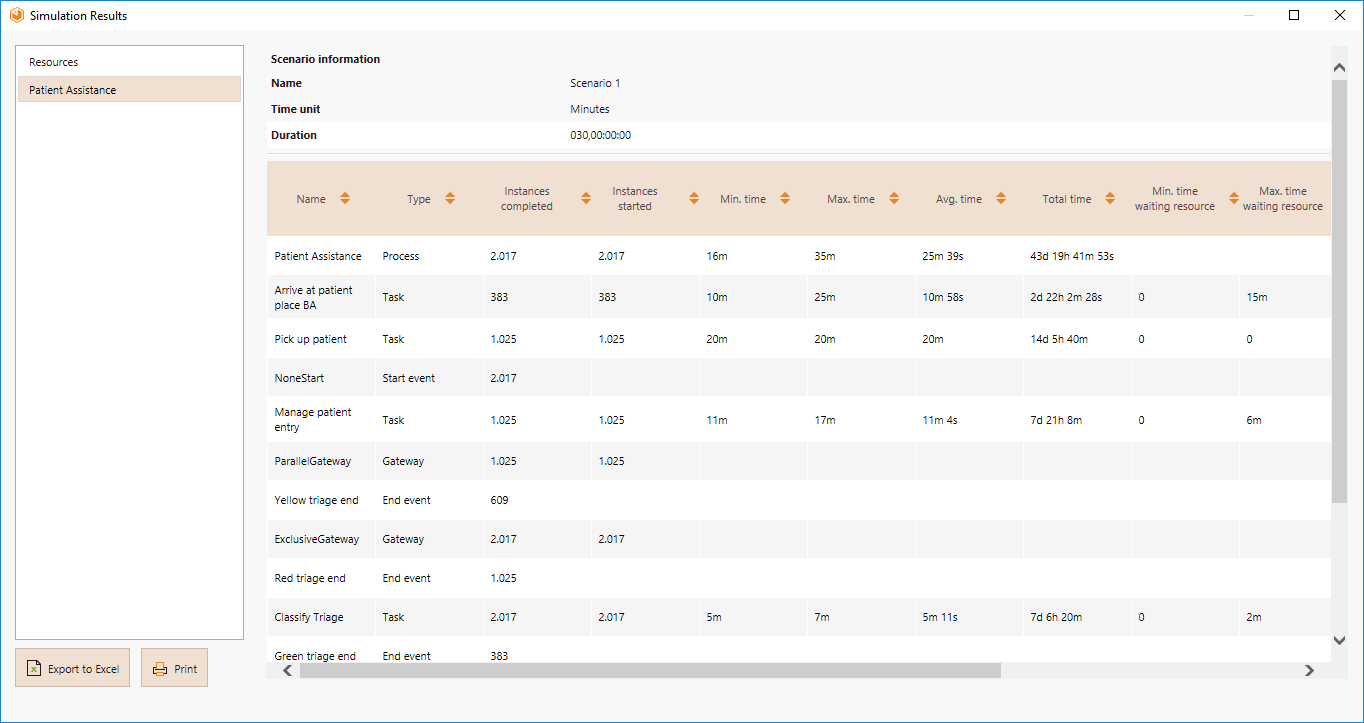
•Name: Identifies the specific shape for which the results are displayed.
•Type: Identifies the element type of the shape.
•Tokens completed: Indicates how many tokens were processed (instances).
•Tokens started: Indicates how many tokens arrived at the shape.
•Minimum time: Indicates the minimum processing time of the shape.
•Maximum time: Indicates the maximum processing time of the shape.
•Average time: Indicates the average processing time of the shape.
•Total time: Indicates the total time employed to process the shape.
•Min. time waiting: Indicates the minimum waiting time for the shape.
•Max. time waiting: Indicates the maximum waiting time for the shape.
•Avg. time waiting: Indicates the average waiting time for the shape.
•Standard deviation waiting: Indicates the standard deviation of the waiting time for the shape.
•Total time waiting: Indicates the total waiting time for the shape.
•Total fixed cost: Indicates the total fixed cost for the shape.
Tab for Resources (All resources)
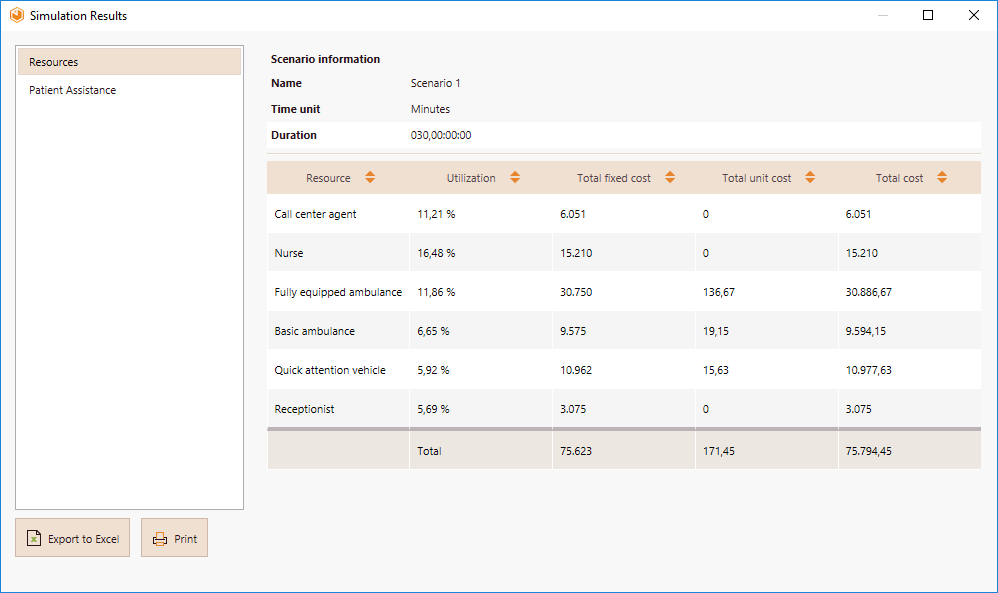
•Usage: Indicates the percentage of time the resource was busy.
•Total fixed cost: Indicates the fixed component cost of using the resource.
•Total unit cost: Indicates the variable component cost of using the resource.
Example: Performing a calendar analysis for the Emergency attendance process
In order to analyze the impact of calendars in the Emergency attendance process, the Emergency department has decided to perform a Calendar analysis.
The shifts for the process will be as follow:
Resource |
Morning shift (6:00 am - 2:00 pm) |
Day shift (2:00 pm - 10:00 pm) |
Night shift (10:00 pm - 6:00 am) |
Call center agent |
2 |
2 |
1 |
Nurse |
3 |
3 |
3 |
Fully equipped ambulance |
4 |
4 |
4 |
Basic ambulance |
2 |
1 |
2 |
Quick attention vehicle |
1 |
2 |
1 |
Receptionist |
2 |
1 |
1 |
1. Create the three calendars (working shifts).
Click the Calendars and add a new Calendar.
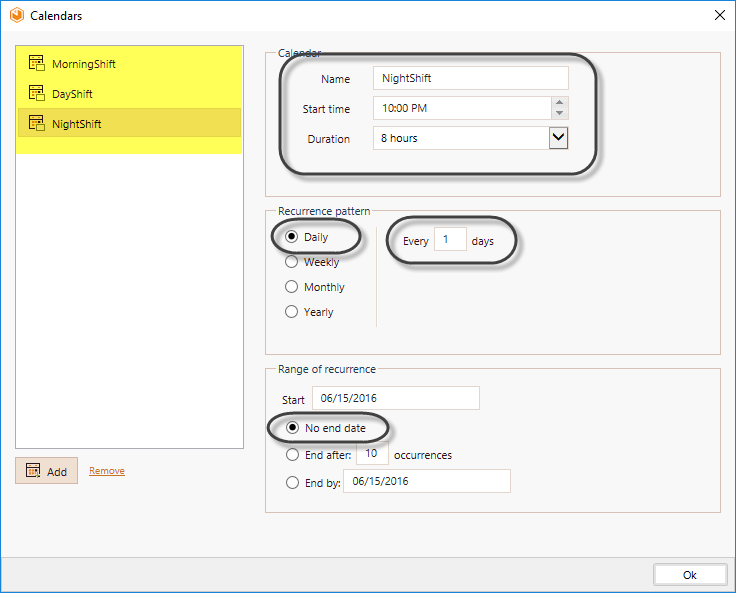
We are going to create the Night shift. In the Calendar configuration options enter the following information:
•Name: Type Night Shift
•Start Time: This calendar starts at 10:00 pm (see table above) so this is the start time
•Duration: This calendar starts at 10:00 pm and finishes at 6:00 am so the calendar duration is 8 hours.
•Recurrence Pattern: This calendar is repeated everyday so select Daily and type 1 in the alongside field.
•Start of recurrence: This calendar applies always so the start date is the same start date of the simulation.
•End of recurrence This calendar applies always so it has no end date.
Repeat the procedure for the morning and day shift calendars.
2. Through the Resources option, set the availability of resource for each calendar created previously.
3. Click the Run button. When the simulation is finished, select Results to view the outcome.
Analyzing the results
Recall that incorporating ever changing conditions in the resource availability gives us a better understanding of true process performance.
The results of the calender analysis will reflect this change. Let us analyze them.
First we examine the process results:

•The average time a patient waits for assistance suffered a little increase from 25 minutes 29 seconds to 25 minutes 39 seconds. This is not significant.
•Despite the presence of waiting times, they are not regarded critical.
The resources usage results will highlight any critical capacity problems.

•The highest usage is for the Nurse. Remember that this resource performs two activities in the process: Classify triage and Manage patient entry.
•From the Process results we can conclude that the usage of nurses is not at full capacity since the waiting times of the associated activities are not significant.
•Assigning shifts and resources did not overtly affect the process in general; therefore, we can conclude that the allocation is adequate for our purpose.
Last Updated 9/13/2023 9:03:51 AM