Overview
This analysis shows the potential effect of resource constrains on process performance. Remember that a Resource is defined as a person, equipment, or space necessary for the execution of a specific task.
In the previous level, Time Analysis, we assumed infinite resource capacity, that is, activities are able to process infinite quantity of tokens at the same time. However this assumption is not practical at all. In real terms there are always resources constraints.
The most common issue arising from introducing resources constraints is that tokens need to wait to be processed at a given moment. This results in bottlenecks and increase in cycle time, thereby reducing the capacity of the process.
Money is another resource directly or indirectly involved in a process. Consequently, this level also allows you to analyze your business operation in terms of costs.
The purpose of this analysis is to identify and minimize the impact of these constraints in terms of cycle time and costs.
The resource analysis results will allow you to evaluate the following performance measures:
•Sub- or over-utilization of resources.
•Total resources costs.
•Total activity costs.
•Delays (time an activity waits for a resource).
•A more accurate expected cycle time.
Defining the input Data required for this level
By default the Performers defined in the process documentation are defined as resources. In the Resources Analysis level you need to define the following parameters:
Resources
Remember that a resource is a person, equipment or space necessary for the execution of a specific task.
To define a Resource click the Resources option found in the ribbon.
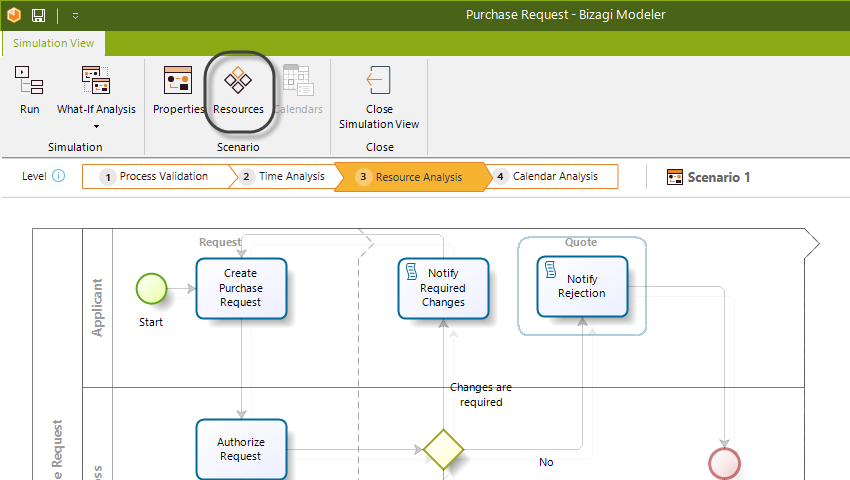
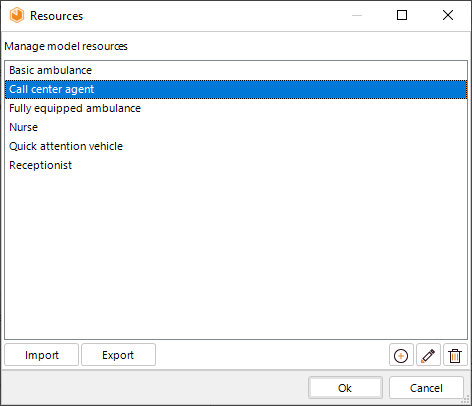
A new window will display the available resources.
To add a new resource, click Add resource.
Select Add performer.
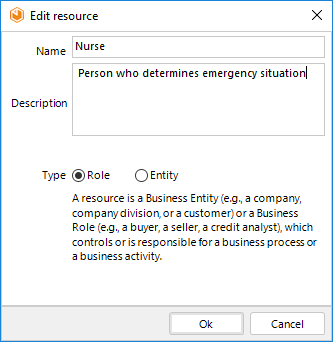
Enter the name, description and type of the new resource. Click OK.
Availability and costs of resources
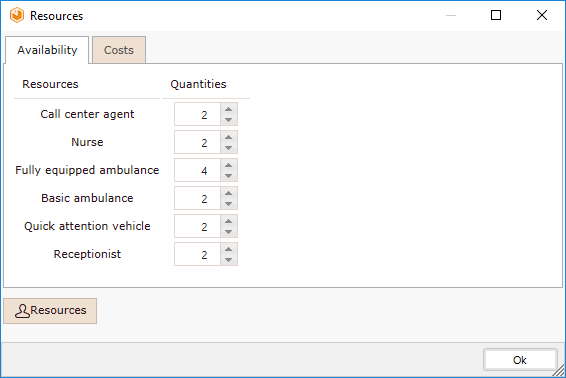
To define availability and costs of resources, select the Resources option found in the Ribbon. The availability of Resources determines how many resources of a given type you have as a whole (not for a particular activity).

A new window will display the available resources. In the Availability tab, enter the value for each Resources available.

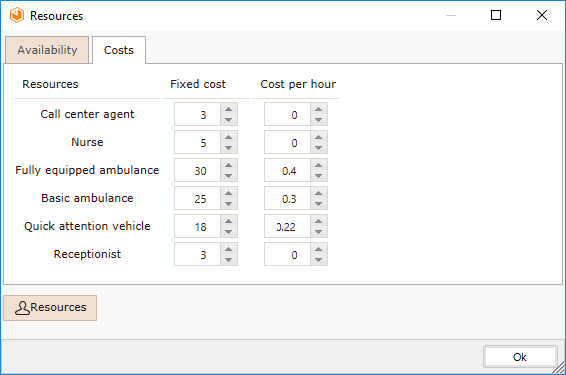
To define the costs of Resources, proceed to the Costs tab.
You can define the fixed and per hour costs for each Resource.
•Fixed cost: This cost is generated each time a resource processes a token.
•Per hour cost: This cost is generated for each hour a resource employs processing a token.
The cost units are defined in the scenario's configuration.
Resources requirements
Tasks require resources to be performed. Once you have defined the process' resources, you have to define how many are required in order to perform a task.
To define the Resources requirements for a task, click the task and select the Resource icon in the pie menu.
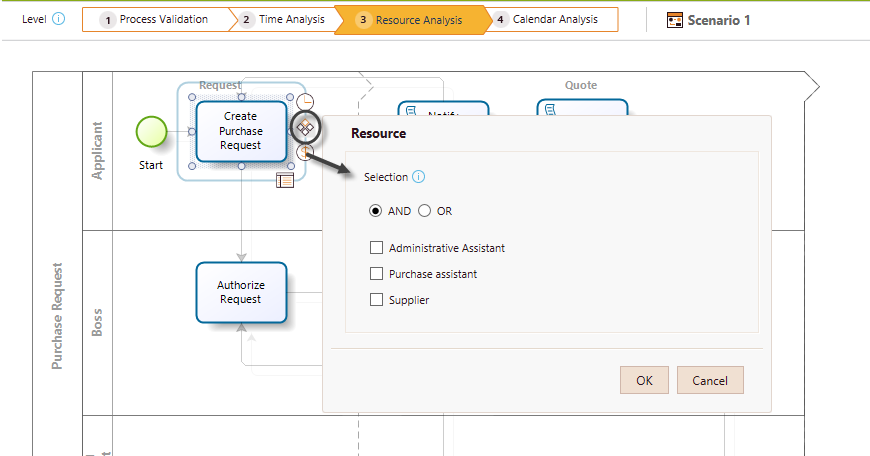
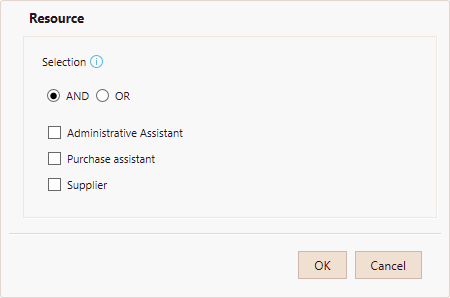
Select the desired resources from the list available in the Resource window.
You can select one or more resources. The AND/OR selection mode is available in order to define if all the selected resources are required by the task at the same time or only one at a time.
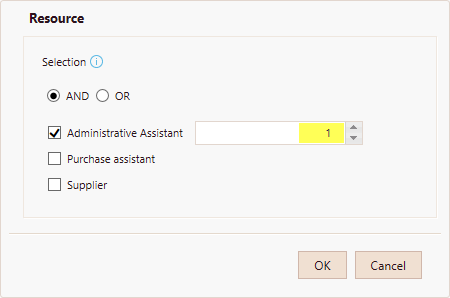
For each resource selected you must define how many of them are used in the task.
Activity costs
The cost of performing an activity, that is, how much an activity costs once executed.
To define the cost of performing an activity, select the Activity and click Cost on the pie menu.
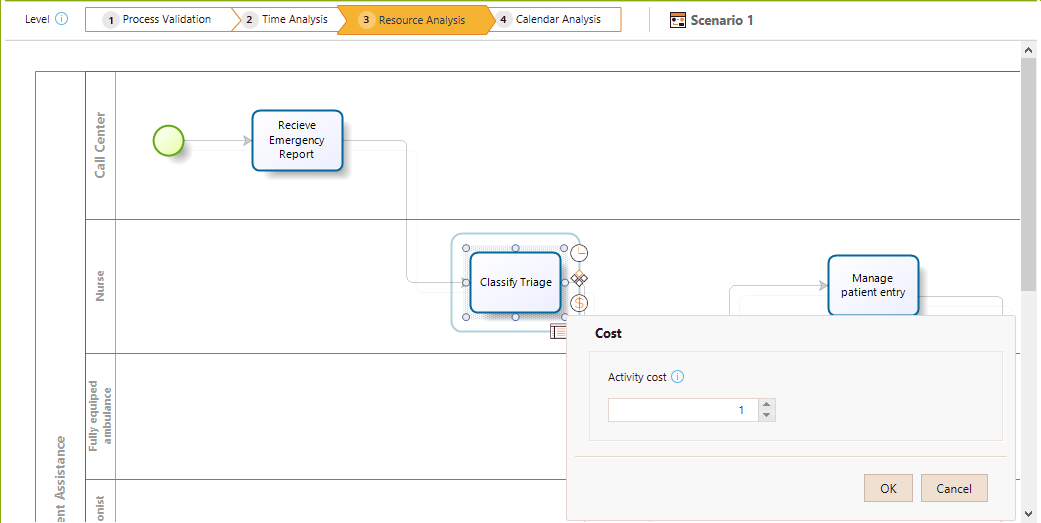
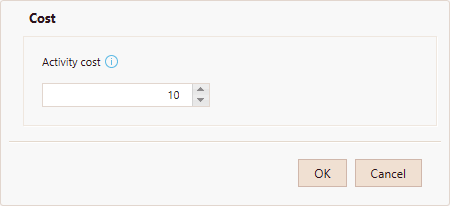
Set a fixed cost amount. The cost units are defined in the scenario's configuration..
Running the simulation
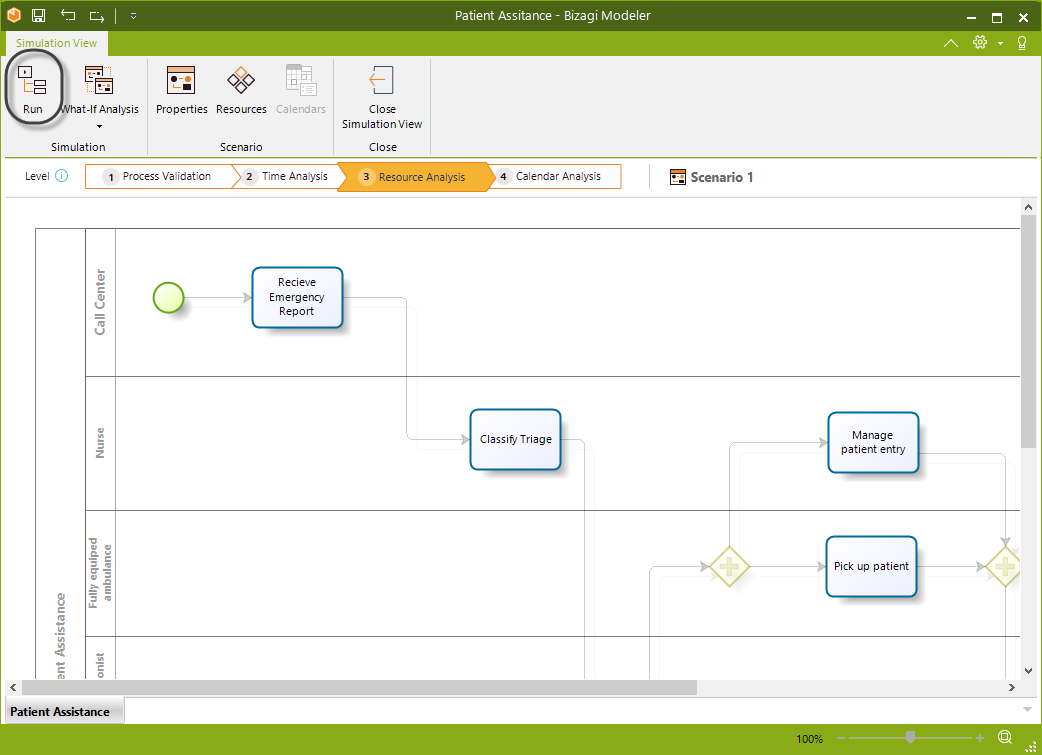
Once the required data has been entered, click the Run button to execute the simulation.
In the new window, click Start to run the simulation.
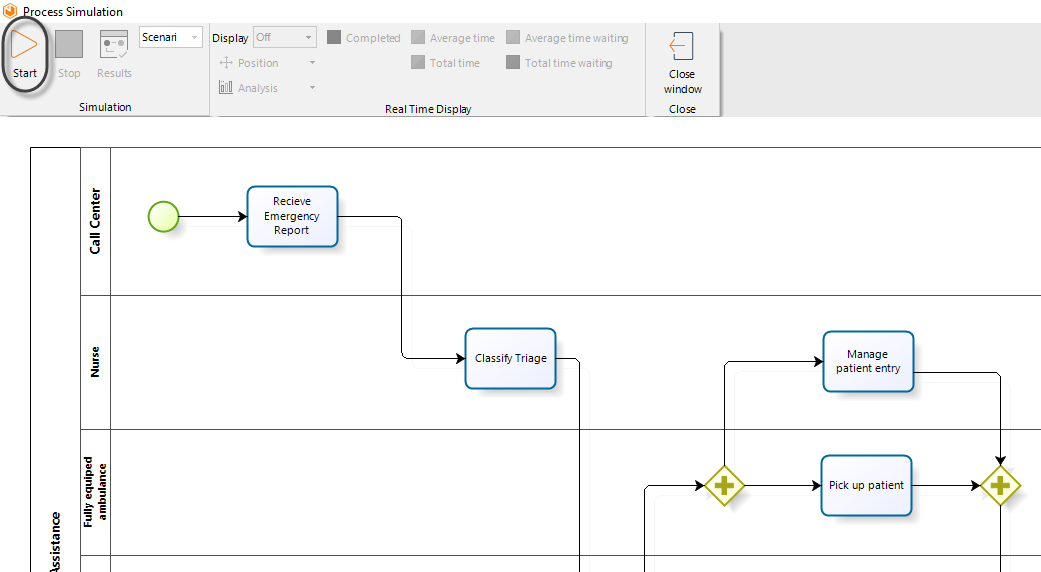
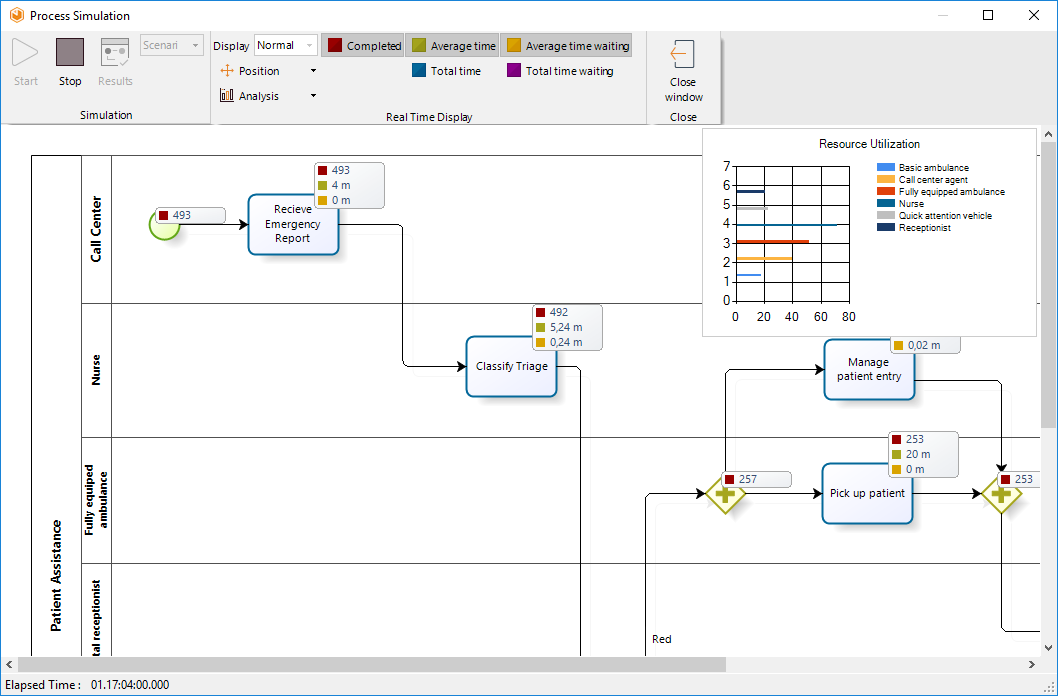
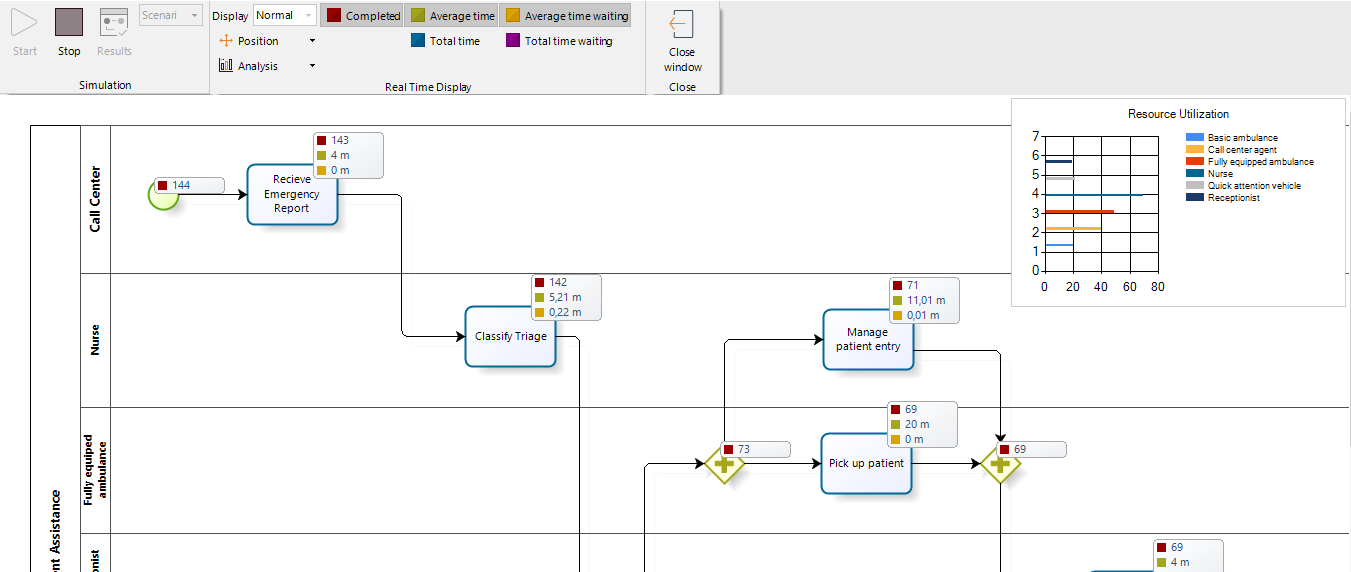
When running a simulation, the following analysis data will display.
•Resource usage status.
•Number of tokens completed.
•Average time per activity.
•Total processing time per activity
•Average waiting time per activity.
Results
When the simulation is complete, select Results to view the outcome.
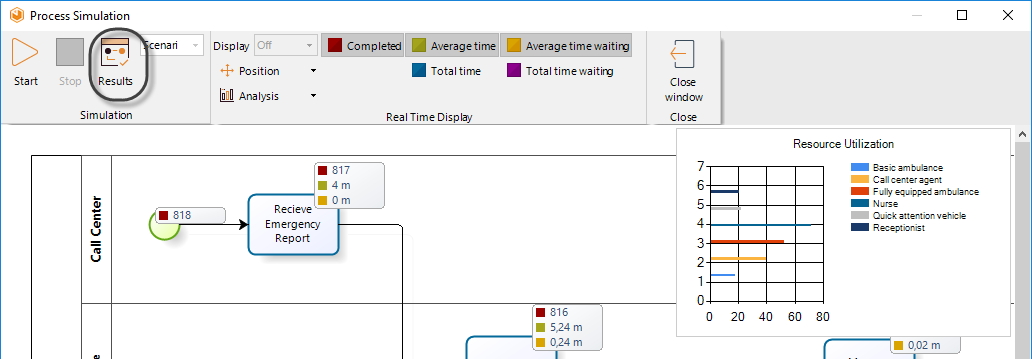
For the Resource Analysis level, the results of the simulated outcome will contain the following information for Process and Resources:
For Process and activities
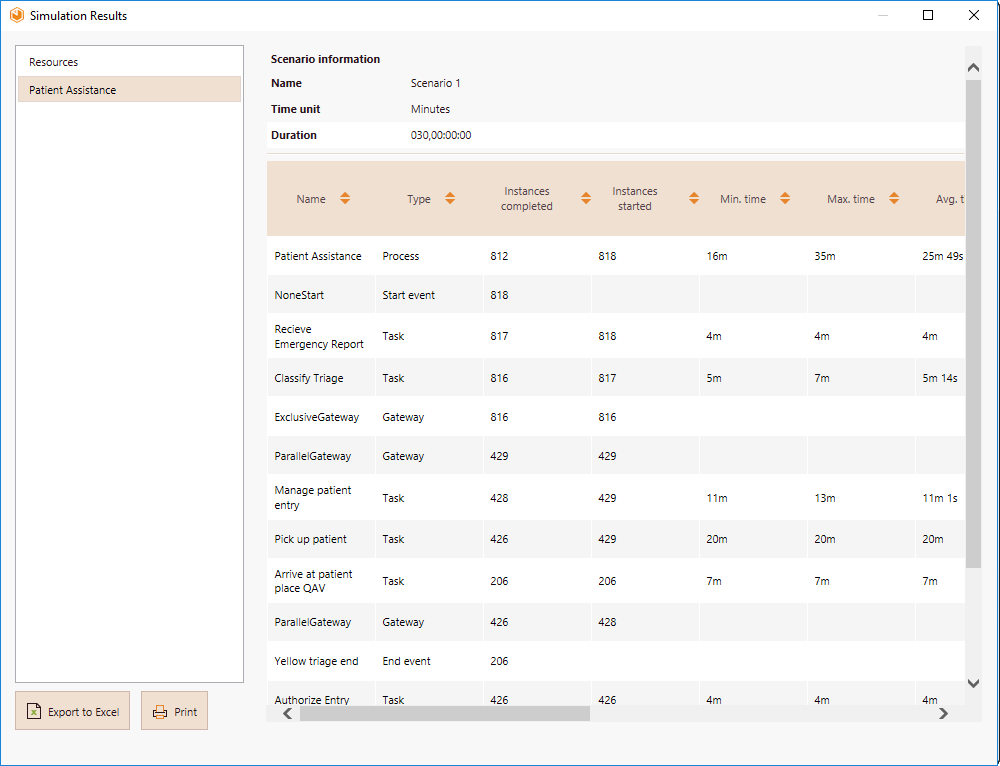
•Name: Identifies the specific shape for which the results are displayed.
•Type: Identifies the element type of the shape.
•Tokens completed: Indicates how many tokens were processed for each specific shape.
•Tokens started: Indicates how many tokens arrived at the shape.
•Minimum time: Indicates the minimum processing time at the shape.
•Maximum time: Indicates the maximum processing time at the shape.
•Average time: Indicates the average processing time at the shape.
•Minimum time waiting resource: Indicates the minimum time a task had to wait for a resource.
•Maximum time waiting resource: Indicates the maximum time a task had to wait for a resource.
•Average time waiting resource: Indicates the average time a task had to wait for a resource.
•Standard deviation: Indicates the standard deviation of the average time a task had to wait for a resource.
•Total fixed cost: Indicates the total cost of performing a task during execution of the simulation.
For Resources
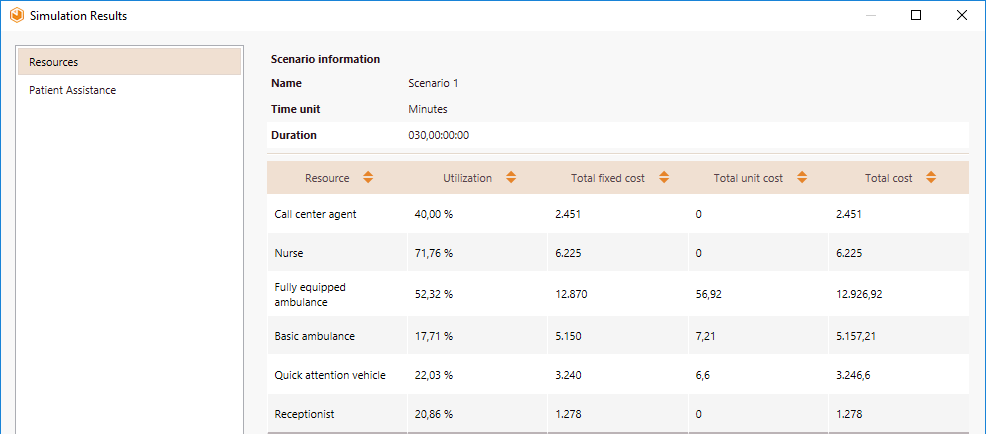
•Usage: Indicates the percentage of time the resource was busy.
•Total fixed cost: Indicates the fixed component cost of using the resource.
•Total unit cost: Indicates the variable component cost of using the resource.
Example: Performing a resource analysis for the Emergency attendance process
In order to analyze the impact of resources constraints in the Emergency attendance process, the emergency department has decided to perform a resource analysis.
For this analysis the following assumptions have been made:
•The expected time between reports is 5 minutes.
•The simulation will evaluate a period of 1 week.
•Resources can be shared between activities.
The following tables respectively show:
•The resources involved in this process, the current available quantity and the related costs.
Resource |
Quantity |
Fixed Cost (US) |
Unit Cost (US) |
|---|---|---|---|
Call center agent |
2 |
3 |
0 |
Nurse |
2 |
5 |
0 |
Fully equipped ambulance |
4 |
30 |
0,4 |
Basic ambulance |
2 |
25 |
0,3 |
Quick attention vehicle |
2 |
18 |
0,22 |
Receptionist |
2 |
3 |
0 |
•The necessary quantity of resources for each activity.
Activity |
Resource |
Quantity |
|---|---|---|
Receive emergency report |
Call center agent |
1 |
Classify Triage |
Nurse |
1 |
Manage patient entry |
Nurse |
1 |
Pick up patient |
Fully equipped ambulance |
1 |
Arrive at patient place QAV |
Basic ambulance |
1 |
Arrive at patient place BA |
Quick attention vehicle |
1 |
Authorize entry |
Receptionist |
1 |
•The cost associated with the performance of each activity.
Activity |
Cost (US dollars) |
|---|---|
Receive emergency report |
2 |
Classify Triage |
1 |
Manage patient entry |
1 |
Pick up patient |
0 |
Arrive at patient place QAV |
0 |
Arrive at patient place BA |
0 |
Authorize entry |
1 |
•The estimated processing times for each of the activities
Activity |
Processing time (min) |
|---|---|
Receive emergency report |
4 |
Classify Triage |
5 |
Manage patient entry |
11 |
Pick up patient |
20 |
Arrive at patient place QAV |
7 |
Arrive at patient place BA |
10 |
Authorize entry |
4 |
Define the required input data for this level: Resources, requirements and costs.
1. Define the resources involved in the process. Create the necessary resources from the Resources option.

2. For each resource define the available quantity, fixed cost and unit cost.

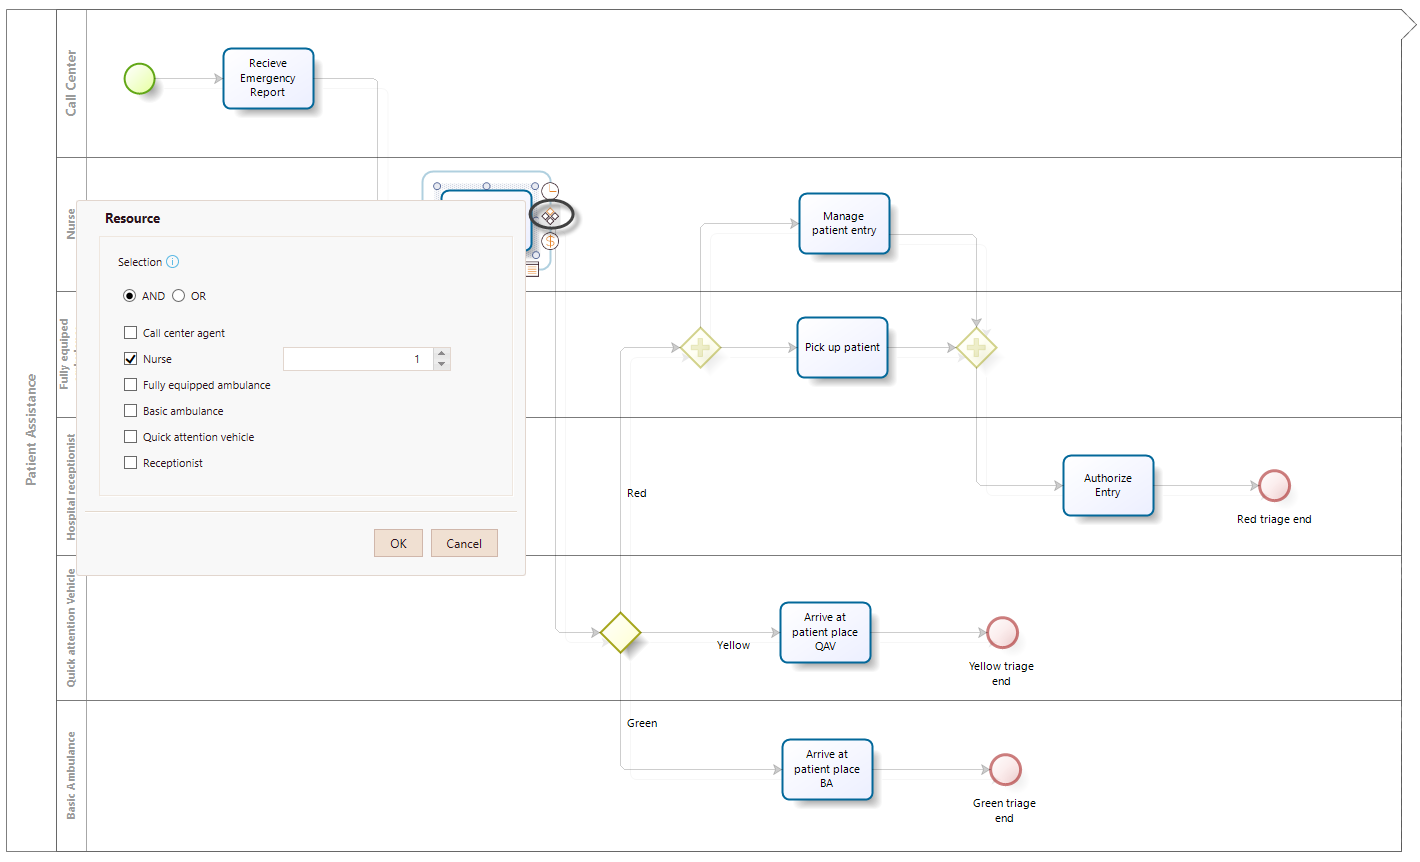
3. Define the resources requirements for each activity. Click the activities and then the Resources icon. Set the resource and number of instances to perform the activity.
For example, here we are defining that the second activity requires a nurse in order to be performed.
4. Finally, define the cost of performing each activity. Click the activity, select Cost and enter the corresponding cost.
Here we are defining the cost of performing the Manage patient entry activity is 1 dollar. This cost is related to paperwork and calls.

5. Click Run, then select Start in the new window to execute the simulation. Note the number of completed Events are displayed. When the simulation is finished, select Results to view the outcome.
Analyzing the results
As we mentioned before, the results of a resource analysis give us a general insight into the cycle time of the process. Consequently, we can identify how the cycle time is affected.
First we analyze the process results.
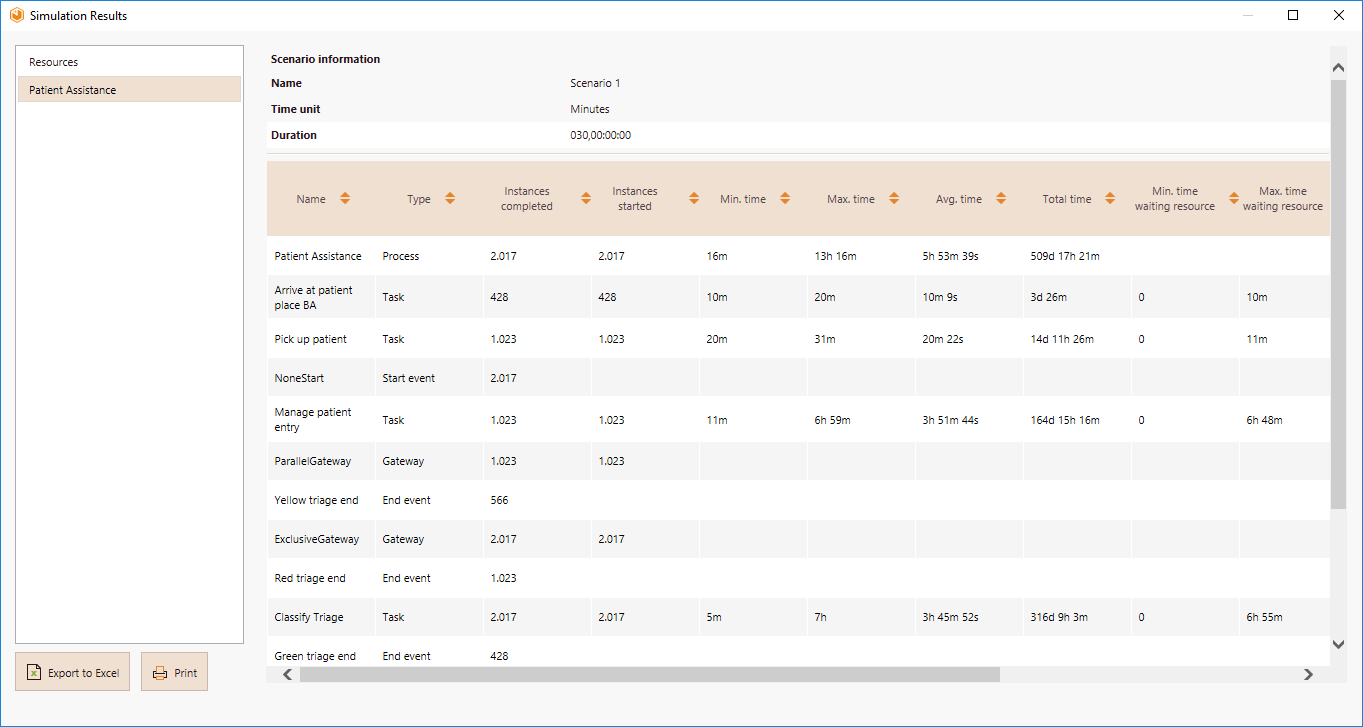
Compared with the best case scenario achieved in the previous level, the inclusion of resources constraints has significantly increased the cycle times.
•The minimum time remains at 16 minutes, and the maximum increased to 13 hours and 16 minutes and now the average is 5 hours, 53 minutes. The previous results only had an average waiting time of 24 minutes 51 seconds.
•As is evident, the processing times for each activity have changed. Now, they reflects delays. The highest average processing times are recorded at Classify triage and Manage patient entry. The average waiting times confirm there is a problem in those activities. Possibly, resources used in them are not enough.
Now lets analyze the resources results.
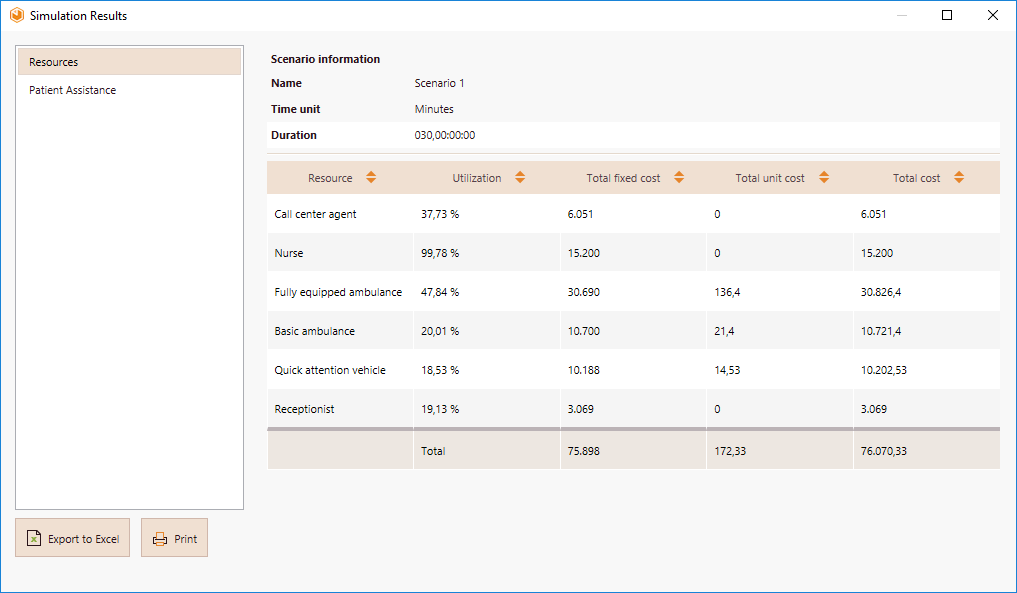
•The usage of the resources indicates some sub and over-utilization.
•For this case we confirm our hypothesis about a possible problem of resources capacity.
•The nurse who performs the Classify triage and Manage patient entry has a usage of 99,78%. This means she is utilized at fully capacity and tokens have to wait until she becomes available. The emergency department should consider increasing the number of triage nurses to reduce service and waiting times, and thereby reducing the cycle time.
We'll see if the situation gets better including a new nurse in the available resources. Now we would have three nurses.
Click Run to simulate the new scenario.
Analyze the new results:
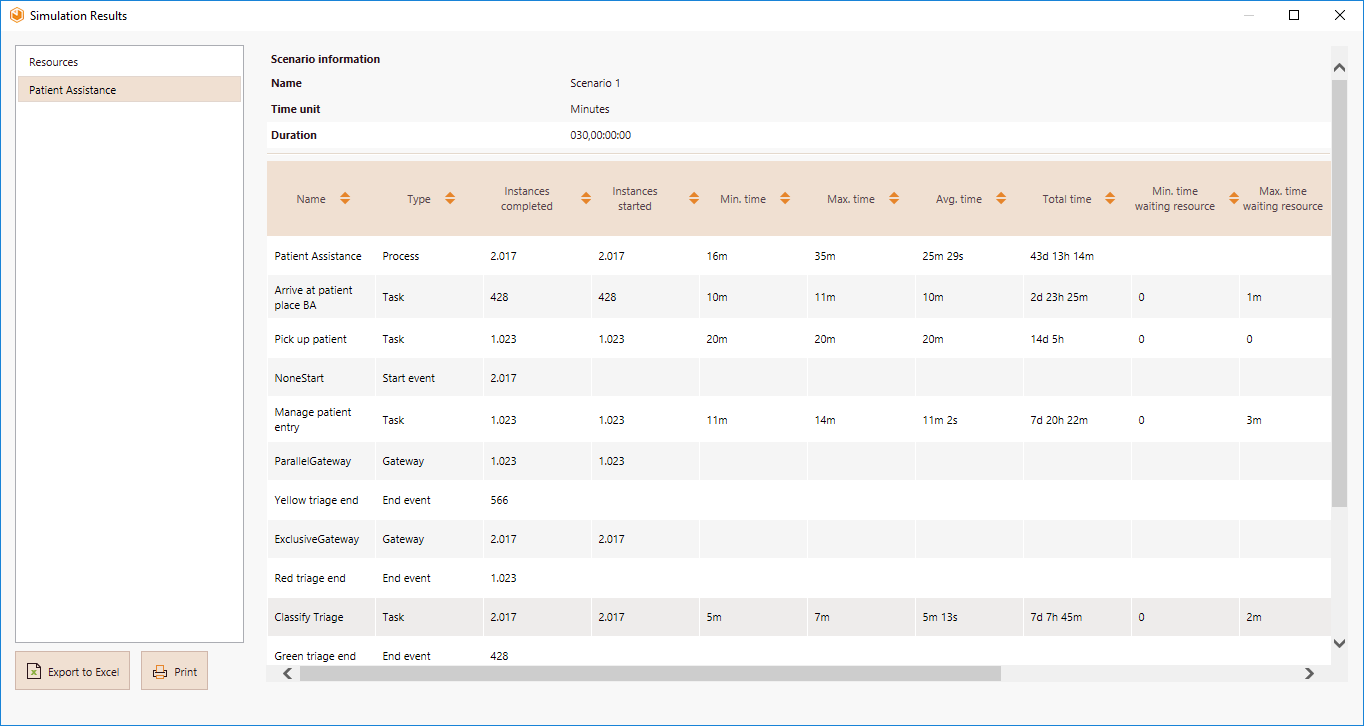
•Introducing another resource brings us closer to the best case scenario with no process delays. The minimum time remains at 16 minutes, the maximum now becomes 35 minutes and the average 25 minutes 29 seconds.
•The results also show waiting times close to 0 in the activities where they exist. The current resources are sufficient to avoid critical delays.
The above can be confirmed from the resources results.
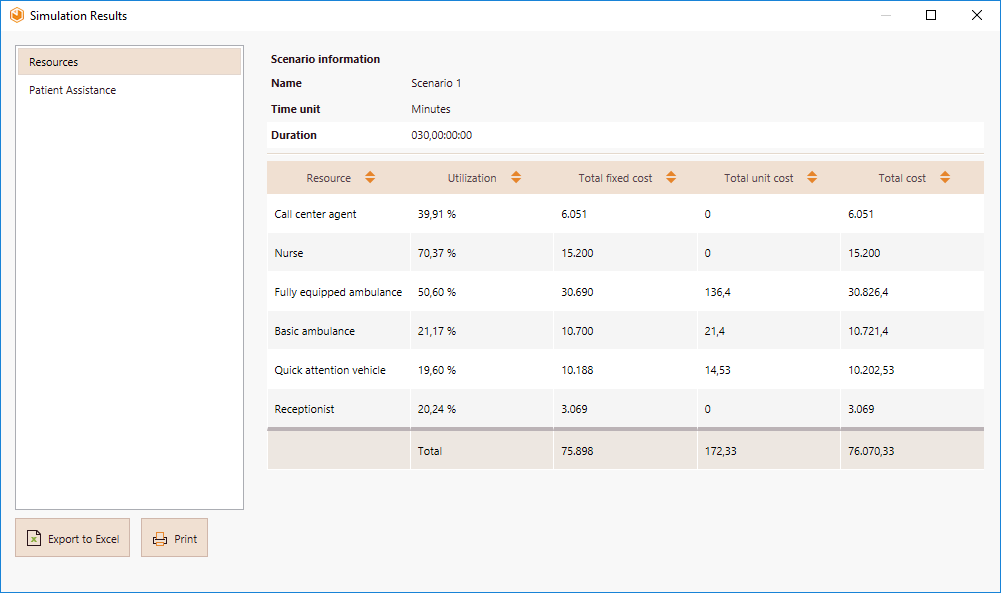
•Usages are acceptable. Nurses now have a utilization of 70,37%.
•There may be other ways to reduce the cost even further and to improve resource utilization, but for now we can accept the state of affairs.
Last Updated 9/13/2023 9:03:05 AM