Bizagi Simulation comprises of four levels. Each subsequent level incorporates additional information exhibiting more complexity than the preceding one, thereby providing a detailed analysis of your processes. Levels are not interdependent, , you may start at any level if you hold the required process data.
Level 1 - Process Validation
The first and most basic simulation level to evaluate the structure of the process diagram.
Data: It requires estimated percentage splits of sequence flows to provide a basis for routing. It also needs the value of the trigger counter contained in the Start Event shape.
Results: The outcomes show all paths activated during the execution and whether all tokens actually finished. Additionally, it evaluates how many tokens passed through each Sequence Flow, Activity and End Event.
![]()
Level 2 – Time Analysis
Second level of simulation to measure the end-to-end process time.
Data: Apart from the data entered in Process Validation, estimated timings (service times) of each activity and the interval time between token generation is required. This data can either be constant or samples from statistical distributions1.
Results: The results show process throughput times for tokens, presented as minimum, maximum, mean and sum (total of all processing times). Similar results can be presented for individual key activities.
![]()
Level 3 – Resource Analysis
Predicts how the process will perform with different levels of resources. This level of detail provides a reliable estimate of how the process will perform in operation.
Data: In addition to the data entered in Time Analysis, this level includes the definition of resources (and/or roles): how many are available and where they are used. Due to the inclusion of resources, the activity times should be adjusted to represent the actual work time; delay due to unavailability of staff will be explicitly indicated.
Results: The structure of the results is similar to Time Analysis. Also, the time spent, the time spent busy or idle for each type of resource is presented.
This level assume an unlimited number of resources.
![]()
Level 4 – Calendar Analysis
Includes calendar information that reflects the process performance over dynamic periods of time, such as shifts, days schedules or weeks.
By default Bizagi includes a chosen calendar that works 24/7. If no calendars are defined, Bizagi will assume that the defined Resources will always be available.
Data: Apart from the data entered in Resource Analysis, it includes the definition of resource calendars.
Results: The structure of the results is similar to Resource Analysis.
![]()
Example
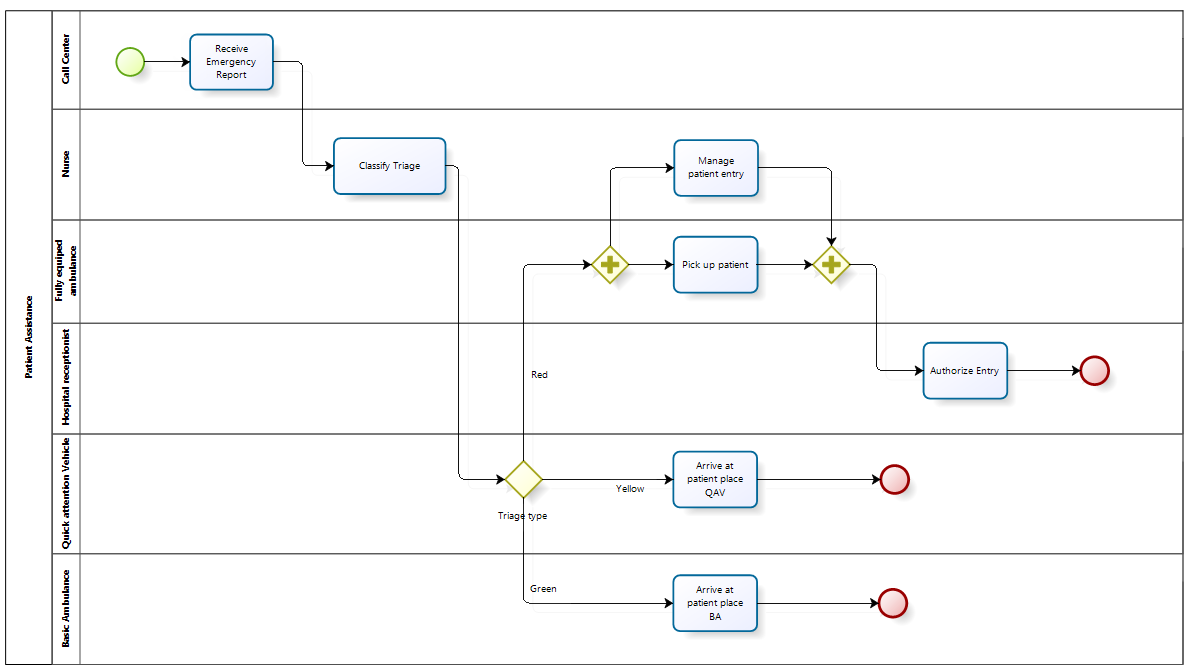
To better illustrate each of the simulation levels let us consider an Emergency attendance process. In this process a call center receives a report of an emergency. Upon receiving the call, a call center agent enters details on the person affected, the symptoms and the physical address where the emergency occurred.
On receipt of the report, a qualified nurse classifies the emergency according to its severity.
•Green: Low severity. The patient can be easily stabilized.
•Yellow: Medium severity. The patient requires special attention but can be stabilized at the place of emergency.
•Red: High severity. The patient must be collected and taken to the nearest hospital.
According to the priority assigned, the Emergency attendance department presents a different level of response.
•Green: This triage is assisted by a quick response vehicle (i.e. a motorcycle) carrying two people: a paramedic and a doctor.
•Yellow: This triage is assisted by a basic ambulance having a doctor, nurse and a paramedic on board.
•Red: This triage is assisted by a fully equipped ambulance holding two doctors, a nurse and a paramedic.
If the emergency is green or yellow, the process finishes once the response team arrives at the at the place of emergency.
If the emergency is red, the fully equipped ambulance transfers the patient to the nearest hospital. During the transfer a nurse carries out the necessary paperwork to make sure quick admittance.
When the patient arrives at the hospital with the necessary paperwork, the receptionist will be able to admit the patient quickly and provide medical assistance immediately.

This process must be carefully analyzed in order to reduce the time between receiving the request and providing medical assistance (at the place of emergency or the hospital). Here, time is life. Bizagi Simulation will help us to make clear decisions to best design the business process and reduce the emergency wait time.
1. Refer to BPSim specification to review statistical distributions supported and their explanation.
Last Updated 9/12/2023 9:22:26 AM