Overview
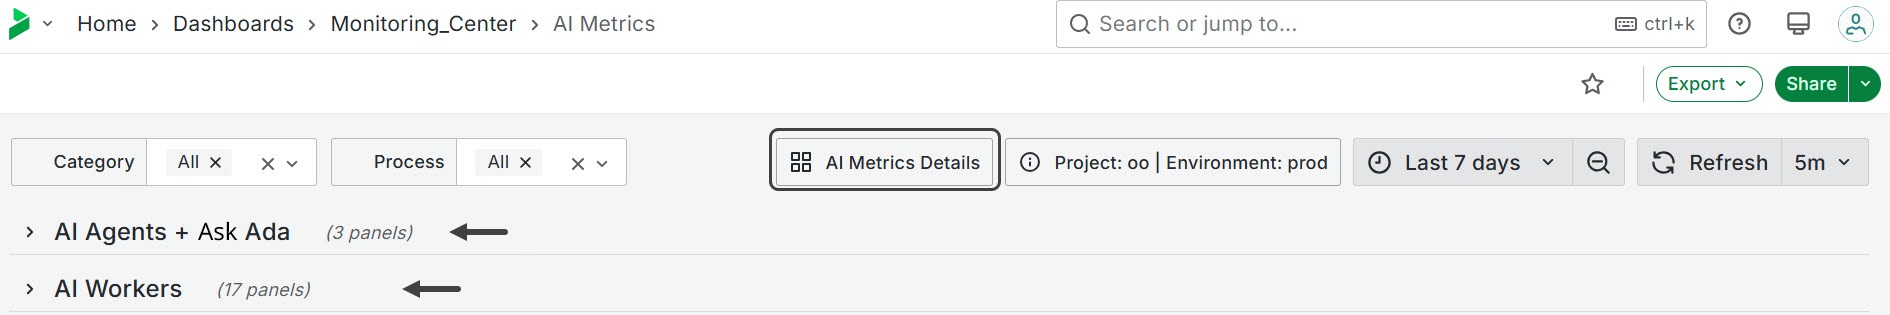
The AI Metrics Dashboard opens when you click AI Metrics in the Monitoring Center Home. The dashboard is organized into three main sections: AI Agents, AI Workers and Ask Ada. You can use the top ribbon to filter information by specific categories and processes. Multiple processes can be selected at once.
AI Agents
The AI Agents dashboard provides visibility into how AI Agents are used, distributed, and consumed. It offers a consolidated view of Agent activity, operational volume, and knowledge usage, enabling you to monitor adoption and understand usage patterns over time.
The dashboard presents usage through time based metrics, distributions, and breakdowns by Agent, knowledge source, and interaction type. The information supports both high level monitoring and more detailed operational analysis.
Metrics highlighted through visual trends and comparisons help identify peaks in activity and opportunities to optimize agent configuration, knowledge sources, and usage policies.
AI Agents Operations
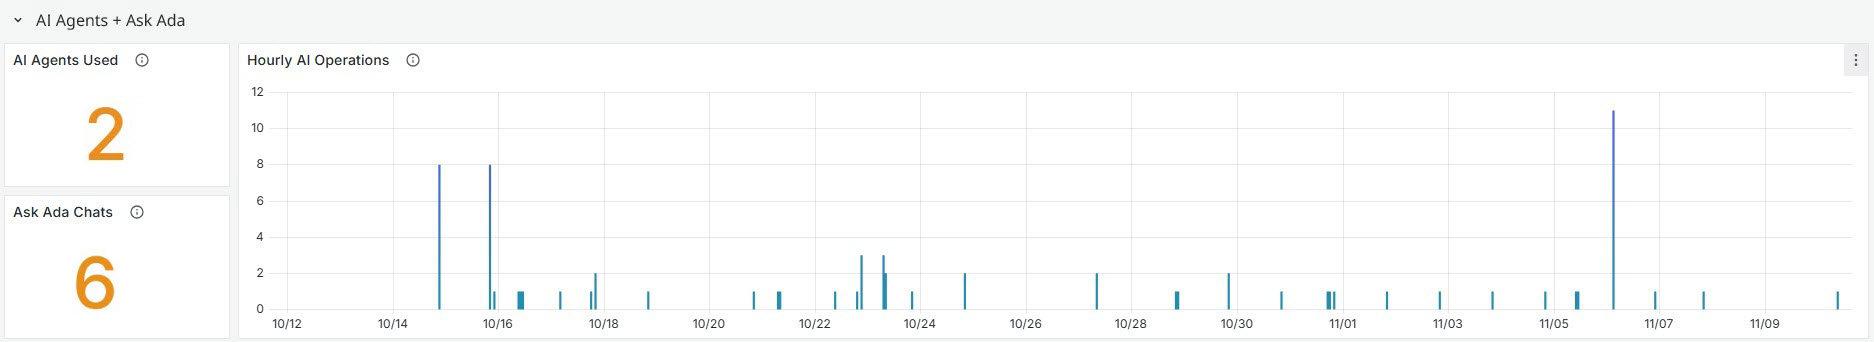
Displays the total number of AI Agent operations executed within the selected time range. An operation represents an interaction or execution performed by an AI Agent.
The accompanying time series graph shows how AI Agent operations evolve over time, helping identify usage trends, spikes in demand, or periods of reduced activity. This information is useful for understanding overall AI workload and adoption patterns.
Total AI Agent Operations
Shows the number of AI Agent operations conducted within the selected date range. This metric is useful for monitoring the frequency and distribution of AI Agent activities, providing insights into operational peaks and periods of inactivity.
AI Agent Operations by Process
Breaks down AI Agent operations by process on an hourly basis within the selected date range. Each line represents the different AI Agents used per process, showing how usage is distributed across the available Agents in the processes that use them.
Data is summarized per hour, allowing teams to understand which processes make the most active use of AI Agents and how relative usage changes over time.
AI Operations by Agent
Provides a breakdown of the number of operations executed by each AI Agent on an hourly basis within the selected date range. Data is aggregated and displayed using the count of operations, summarized per hour for each Agent.
The visualization helps teams identify the most frequently used AI Agents and understand how activity is distributed over time.
Today
Displays the number of AI operations conducted on an hourly basis.
Current Week - Previous Week - This Month
Display AI Agent interactions for the indicated periods, regardless of the filter applied at the top of the page.
These activities provide insights into operational peaks and periods of inactivity.
AI Agent Distribution
The AI Agent Distribution section provides insight into how AI Agents are embedded and consumed across processes, entities, and dependency types. It helps you understand where AI Agents are being used, how they are integrated, and which business areas rely on them most.
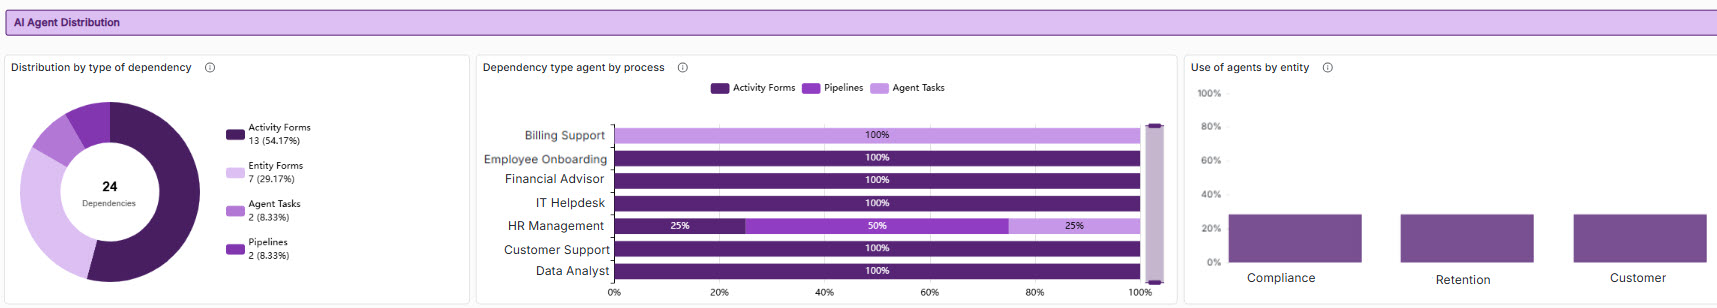
Dependency type distribution
Shows the distribution of AI Agent dependencies by dependency type. Each segment represents a different way in which AI Agents are integrated into the platform, such as:
•Activity Forms
•Entity Forms
•Agent Tasks
•Pipelines
The total number in the center represents the total count of AI Agent dependencies detected within the selected scope. The percentage and count for each segment indicate how frequently AI Agents are referenced through a specific dependency type.
Dependency Type by Process
Illustrates the distribution of dependency types per process using a stacked horizontal bar chart. Each bar represents a process, and the colored segments within each bar indicate the proportion of dependency types, such as Activity Forms, Pipelines, or Agent Tasks, used by AI Agents in that process. The bars are normalized to 100%, making it easy to compare relative usage patterns across processes.
AI Agent usage by entity
Displays AI Agent usage grouped by business entity. Each bar represents an entity, and its height indicates the relative level of AI Agent usage within that entity. The chart provides a high level view of how AI capabilities are distributed across different business domains.
AI Agents Knowledge
The AI Agents Knowledge section provides visibility into how AI Agents consume and apply knowledge when executing tasks across processes. It focuses on the relationship between agents and their knowledge sources, highlighting the type, distribution, and relative usage of knowledge that supports agent behavior.
By comparing knowledge usage across processes, it becomes possible to identify differences in configuration, consistency of knowledge application, and opportunities to improve governance and coverage.
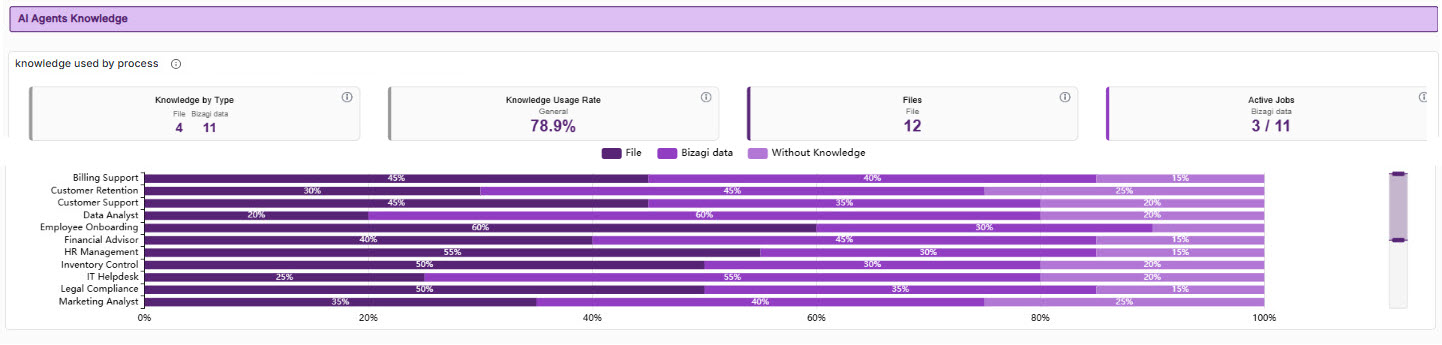
AI Agent Knowledge usage by process
Presents how AI Agents consume Knowledges across processes, combining high level indicators with a normalized process level breakdown to provide both context and detail.
At the top of the chart, summary indicators provide an overview of Knowledge usage. The indicators show the total number of Knowledge references used by AI Agents, the overall Knowledge usage rate, the total size of the Knowledge involved, the number of Knowledge artifacts available, and the number of jobs activated that relied on Knowledge.
Below, the main visualization displays a stacked horizontal bar chart showing Knowledge usage by process. Each bar represents a process and is divided into segments corresponding to different types of Knowledge used by AI Agents, such as Files Knowledge, Bizagi Data Knowledge, and Agents without defined Knowledges. The bars are normalized to 100%, allowing direct comparison of the relative composition of Knowledge usage across processes regardless of overall activity level.
The visualization highlights how different processes rely on different Knowledge strategies.
Overall, the chart helps explain not only how much Knowledge AI Agents use, but also how that Knowledge is structured and applied across processes, supporting informed decisions about Knowledge management, optimization, and AI Agent configuration.
AI Workers
The AI Workers section displays process level graphs related to AI Workers. This section is divided into four subsections.
Presents AI Worker accuracy metrics at the process level and shows how the accuracy score evolves over time. It includes both the % Accuracy Score of Workers widget displayed in the AI Metrics Home view and an AI Worker Accuracy Score by Process graph that allows multiple processes to be selected for comparison.
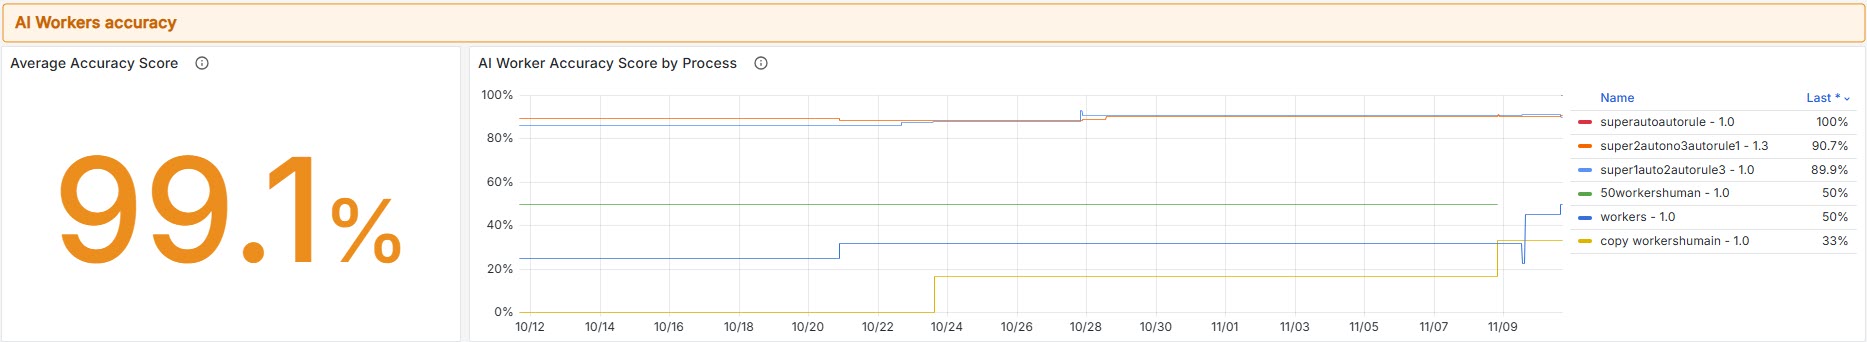
This metric reflects the reliability of tasks powered by AI Workers within each process. It measures how accurately AI Workers complete Form based tasks by analyzing the extent of human corrections made after an AI Worker has finished its work. The accuracy score is calculated based on the number of manual edits applied to Form fields after AI Worker completion.
Fewer human corrections indicate higher accuracy, while frequent interventions suggest areas where the AI Worker may require additional training. The score provides valuable insights into AI Worker performance and training effectiveness. It helps identify opportunities for optimization, improve automation quality, and build trust in AI Worker driven processes.
Presents process level metrics related to AI Worker distribution, organized into two main visualizations: AI Workers versus Manual Tasks Distribution by Process and AI Worker Types Distribution by Process.
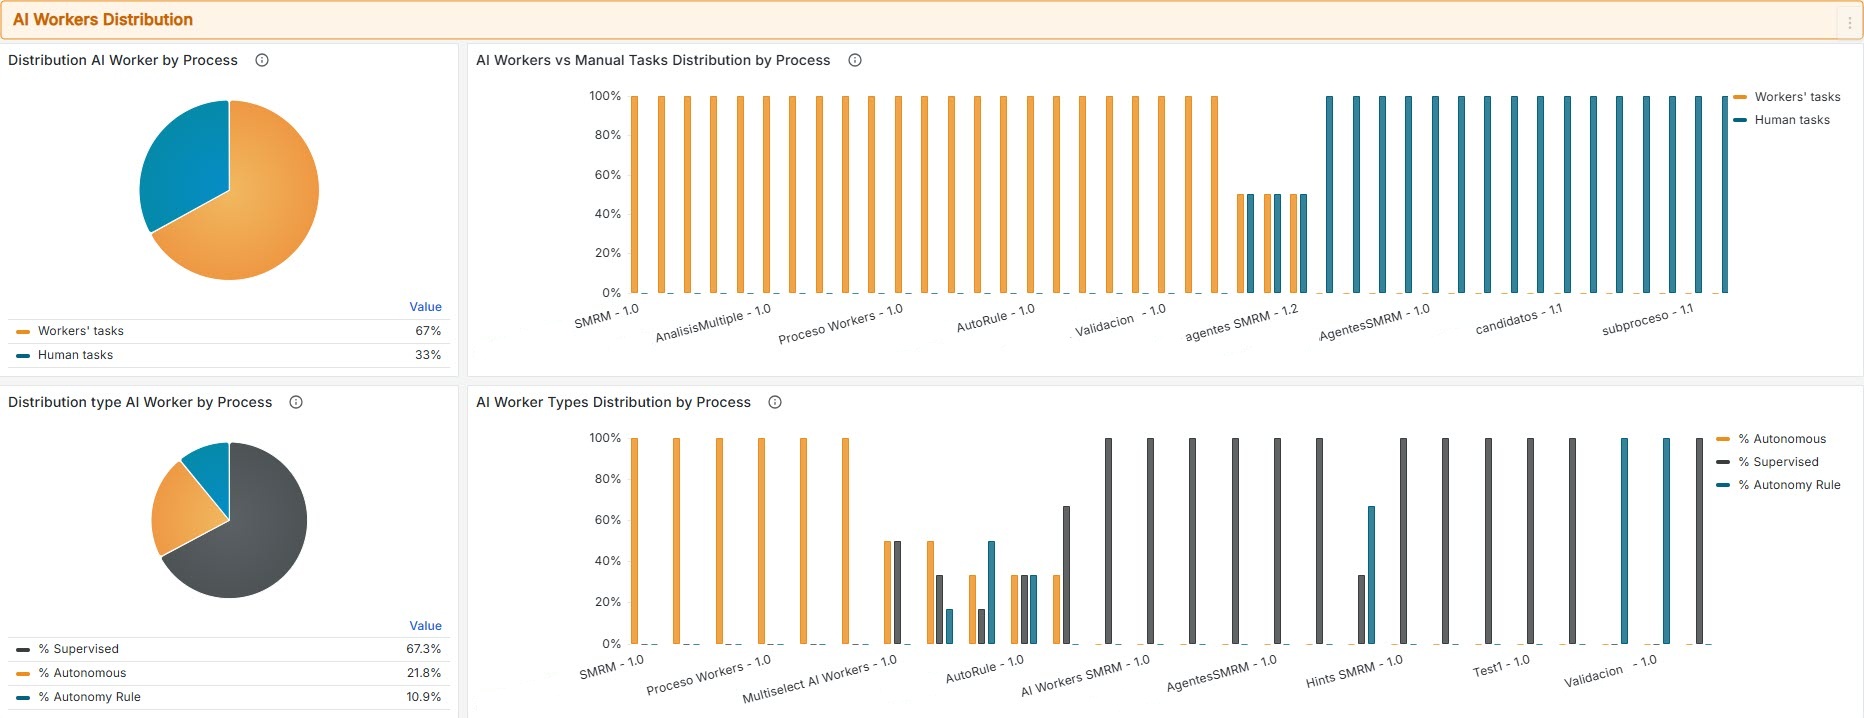
AI Workers vs. Manual Tasks Distribution by Process
Shows task distribution within each process, comparing tasks with AI Workers enabled and tasks without AI Workers. The metric is complemented by a Distribution of AI Worker by Process chart that illustrates the percentage split between AI Worker driven tasks and human executed tasks.
AI Worker Types Distribution by Process
Displays the distribution of AI Worker types within each process, categorizing tasks according to their level of automation.
The metric is complemented by a Distribution Type AI Worker by Process chart that illustrates the percentage split among the different AI Worker types:
•Supervised: Manual tasks that require human review and intervention.
•Autonomy Rules: Semi-automated tasks that progress based on predefined business rules.
•Autonomous: Fully automated tasks that do not require human intervention.
Provides key performance metrics related to autonomous AI Worker execution at the process level to help assess reliability and effectiveness.
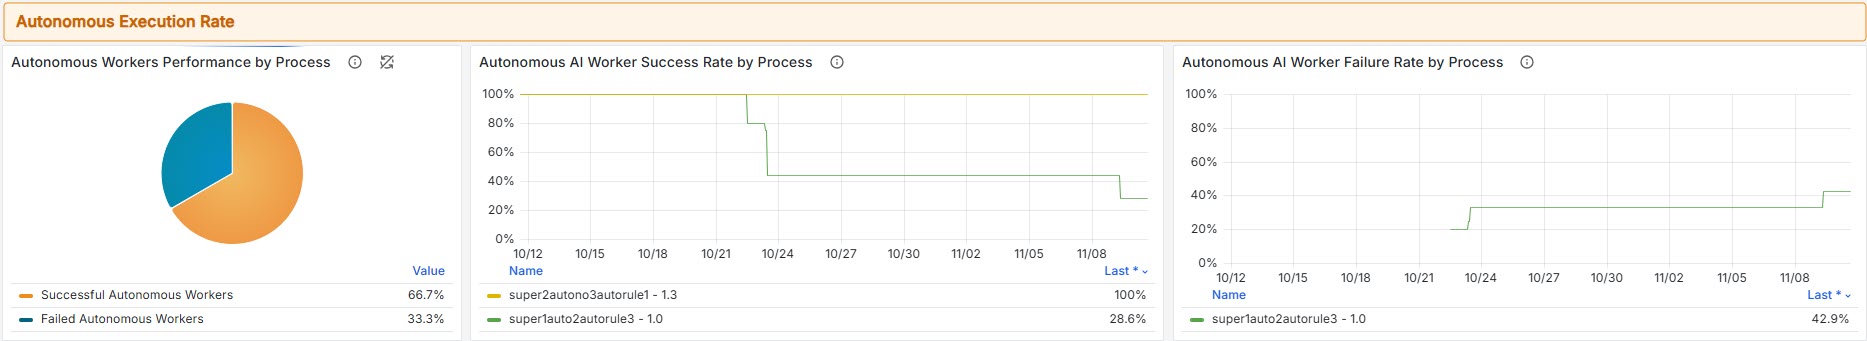
Autonomous AI Worker Success Rate by Process
Shows the percentage of autonomous tasks within each process that were successfully completed without human intervention. The metric serves as a key performance indicator for evaluating AI Worker reliability and overall automation effectiveness. High success rates suggest AI Workers are well trained and capable of independently handling assigned tasks.
Autonomous AI Worker Failure (Fallback) Rate by Process
Indicates the percentage of autonomous tasks that failed to execute automatically and required manual intervention to proceed. Failures may result from unexpected errors or edge cases not covered by the AI Worker's training or rule set. Monitoring the metric is essential for identifying reliability issues and improving AI Worker robustness.
Presents feedback metrics for AI Workers at the process level, offering insights into user satisfaction and performance quality.
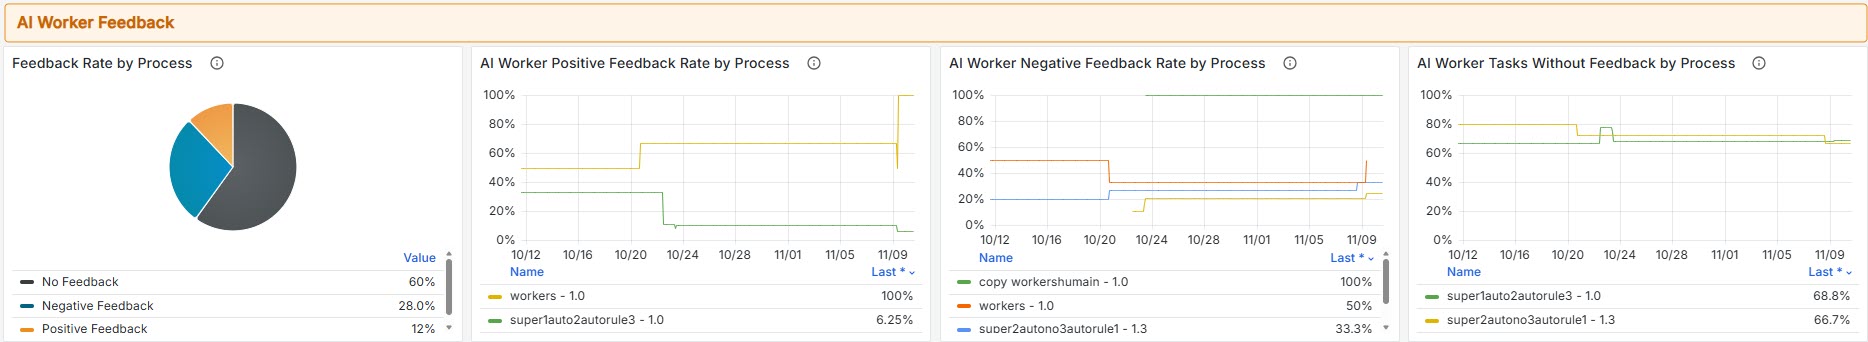
AI Worker Positive Feedback Rate by Process
Shows the percentage of tasks within each process that received positive feedback ratings. The metric reflects user satisfaction and the perceived quality of AI Worker performance across business processes, helping identify the most successful AI Worker implementations.
AI Worker Negative Feedback Rate by Process
Shows the percentage of tasks within each process that received negative feedback ratings. The metric helps identify problematic AI Worker implementations and processes that may require improvement or additional training.
Monitoring negative feedback is essential for maintaining high performance standards and user satisfaction.
AI Worker Tasks Without Feedback by Process
Shows the percentage of tasks within each process that received neither positive nor negative feedback. High percentages may indicate low user engagement, missing feedback mechanisms, or tasks completed without user interaction. The insight helps uncover opportunities to improve feedback collection and encourage greater user participation.
AI Worker Knowledge
The AI Workers Knowledge section provides visibility into how AI Workers leverage Knowledge when performing tasks. The focus is on understanding the extent to which Knowledge is actively used during AI Worker execution and how usage varies across Worker roles or processes.
This section helps identify scenarios where AI Workers operate with or without Knowledge support, providing insight into the adoption of Knowledge assets by contrasting Knowledge assisted execution with execution that does not rely on Knowledge.
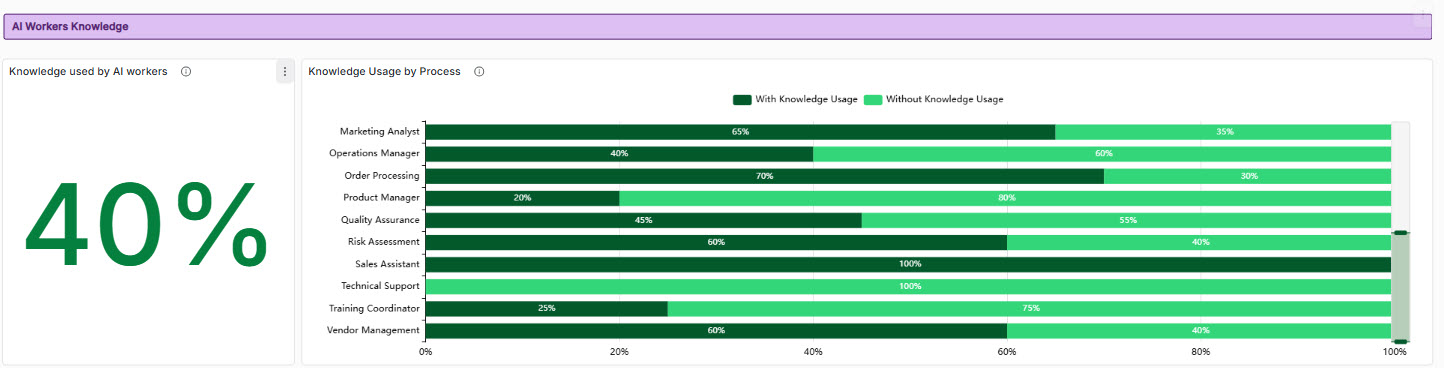
AI Worker Knowledge usage
On the left, a single value indicator displays the percentage of AI Worker executions that use Knowledge within the selected time range. The metric provides an immediate understanding of how frequently Knowledge assets are involved in AI Worker activity.
AI Worker Knowledge usage by process
On the right, a stacked horizontal bar chart shows Knowledge usage by process or Worker role. Each bar represents a process and is divided into two segments indicating the proportion of executions performed with Knowledge usage versus without Knowledge usage. The bars are normalized to 100%, enabling direct comparison across processes regardless of execution volume.
The chart highlights differences in how knowledge is applied across processes using AI Workers. Some processes may consistently rely on Knowledge to perform tasks, while others operate largely without it.
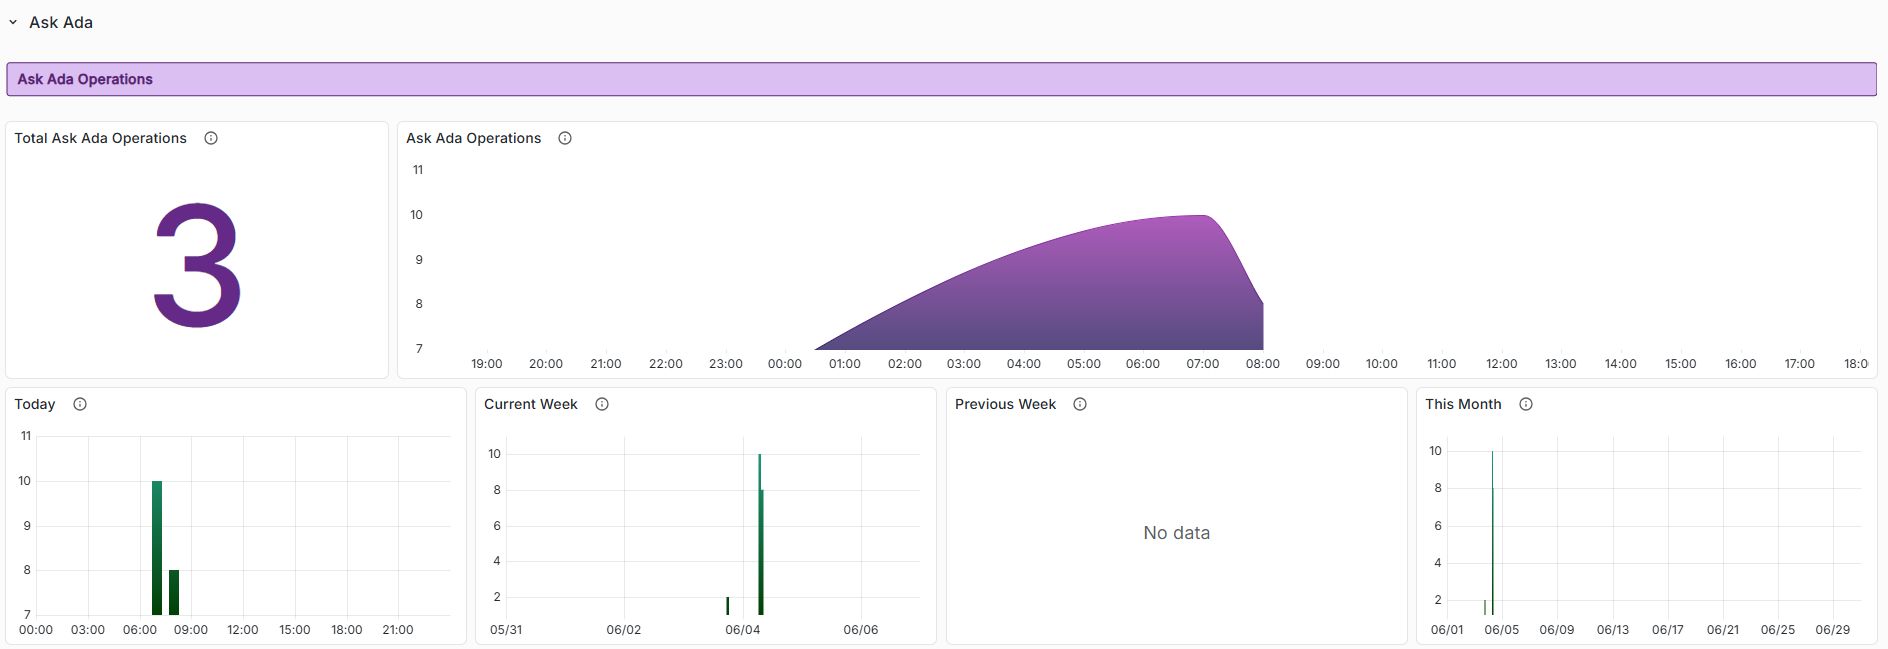
The Ask Ada section provides visibility into how the Ask Ada feature is used across applications. It helps you understand usage patterns, identify trends over time, and evaluate adoption at different time scales. By analyzing the available metrics, you can monitor engagement and detect changes in how users interact with Ask Ada.
Total Ask Ada Operations
Shows the total number of Ask Ada operations within the selected time range. The indicator provides a quick overview of overall usage and helps quantify the volume of interactions with Ask Ada.
Ask Ada Operations (over time)
Displays the number of Ask Ada operations conducted on an hourly basis within the selected date range. The metric is useful for monitoring the frequency and distribution of Ask Ada interactions, providing insights into operational peaks and periods of inactivity.
Today, Current week, Previous week, This month
Presents the number of Ask Ada operations during the selected time frame, grouped by day. The chart helps identify usage trends, such as increased adoption or specific days with higher activity.
Last Updated 7/17/2026 11:08:57 AM