Overview
The AI Metrics section in the Monitoring Center Home provides at-a-glance metrics on AI operations, particularly those from AI Agents, Ask Ada, and AI Workers. Key metrics are displayed along with links to detailed dashboards for deeper analysis. Clicking the AI Metrics button opens the detailed AI Metrics Dashboard window.
Home - Monitoring AI Metrics
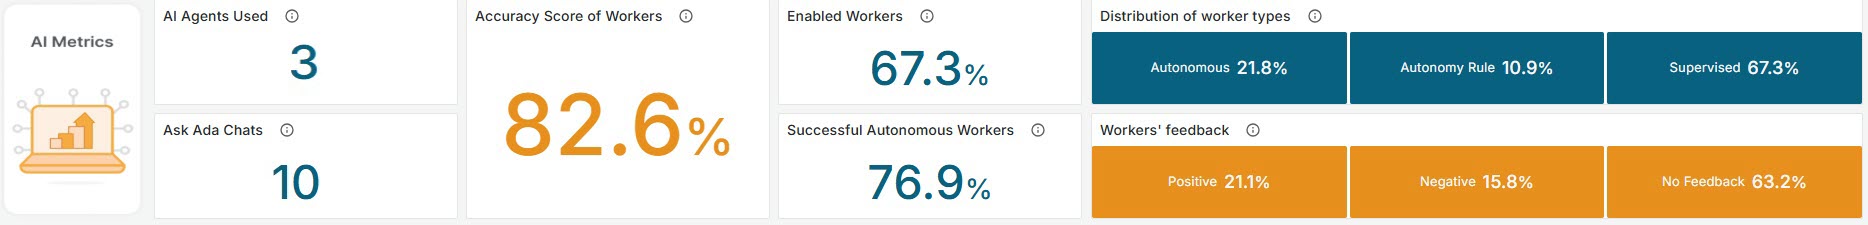
AI Agents Used
Displays the total number of unique AI Agents utilized within the specified timeframe. Each AI Agent is counted once, regardless of how many times it was used during the selected period. The metric provides insight into the diversity of AI resources employed over time.
Ask Ada Chats
A chat is defined as the entire session of interactions that a user has with the Ask Ada assistant before the conversation context is lost. The conversation maintains its context as long as the user continues interacting without leaving the assistant or the app. During a single chat session, a user may ask multiple questions and receive multiple answers, all within the same continuous interaction. When the end user exits the Ask Ada interface or the app and returns later, the previous context is considered lost. Upon returning, any new interactions begin a new chat session, which is counted separately in the chart.
This widget displays the total number of chat interactions handled by Ask Ada within the specified period. The value is calculated by filtering distinct chat sessions, providing an overview of user engagement.
% Accuracy Score of Workers
Reflects the reliability of tasks powered by AI Workers within each process. The score measures how accurately AI Workers complete Form based tasks by analyzing the extent of human corrections made after an AI Worker has finished its work. Calculation is based on the number of manual edits applied to Form fields following AI Worker completion. Fewer human corrections indicate higher accuracy, while frequent interventions suggest areas where additional training may be required.
The resulting score provides valuable insight into AI Worker performance and training effectiveness. It helps identify opportunities for optimization, improve automation quality, and build trust in AI Worker driven processes. For detailed information, see the AI Metrics Dashboard - AI Workers Accuracy documentation.
% Enabled Workers
Shows the percentage of AI Workers enabled across all tasks in the selected environment. A higher percentage indicates broader adoption of AI capabilities, reflecting increased use of intelligent automation to support task execution. For detailed information, see the AI Metrics Dashboard - AI Workers distribution documentation.
% Successful Autonomous Workers
Shows the percentage of successful completions by autonomous AI Workers. The value reflects how many autonomous workers complete tasks satisfactorily. A higher percentage indicates stronger performance and greater reliability of autonomous AI execution. For detailed information, see the AI Metrics Dashboard - Autonomous Execution Rate documentation.
Distribution of Worker Types
Presents the percentage distribution among the three AI Worker types: Autonomous, with Autonomy Rule, and Supervised. For detailed information, see the AI Metrics Dashboard - AI Workers distribution documentation.
Workers' Feedback
Presents the percentage distribution of AI Worker feedback, indicating whether feedback was positive, negative, or not provided. The information reflects user ratings of AI performance and helps assess how effectively AI Workers support task execution. For detailed information, see the AI Metrics Dashboard - AI Worker Feedback documentation.
Last Updated 7/17/2026 8:55:15 AM