Overview
In the Customer Portal, you have a centralized summary of your project and its environments. Here you can review number of provisioned environments, the category of your environment, and the Bizagi version installed in each environment. Additionally, you can manage administrators of your subscription projects.
Project and environment management
Every project has information displaying the number of active environments. Under the project name you can find:

•Total environments.
•Creation date
When you open the project information you can find all the environments, you can review the information associated with each environment:

•Type of environment: test, staging, or production.
•Category
•Provisioning date.
•Number of BPUs of the category.
•The version of Bizagi installed in that environment.
Additionally, you can perform the following administrative tasks on each environment:
BPU report
The subscription owner or contributors of the Automation service can measure the BPUs consumed per environment. This is useful to follow-up the resources consumption, and making decision about scaling up to the next Performance level. Once you select a project, go to the BPU report tab to see the report.
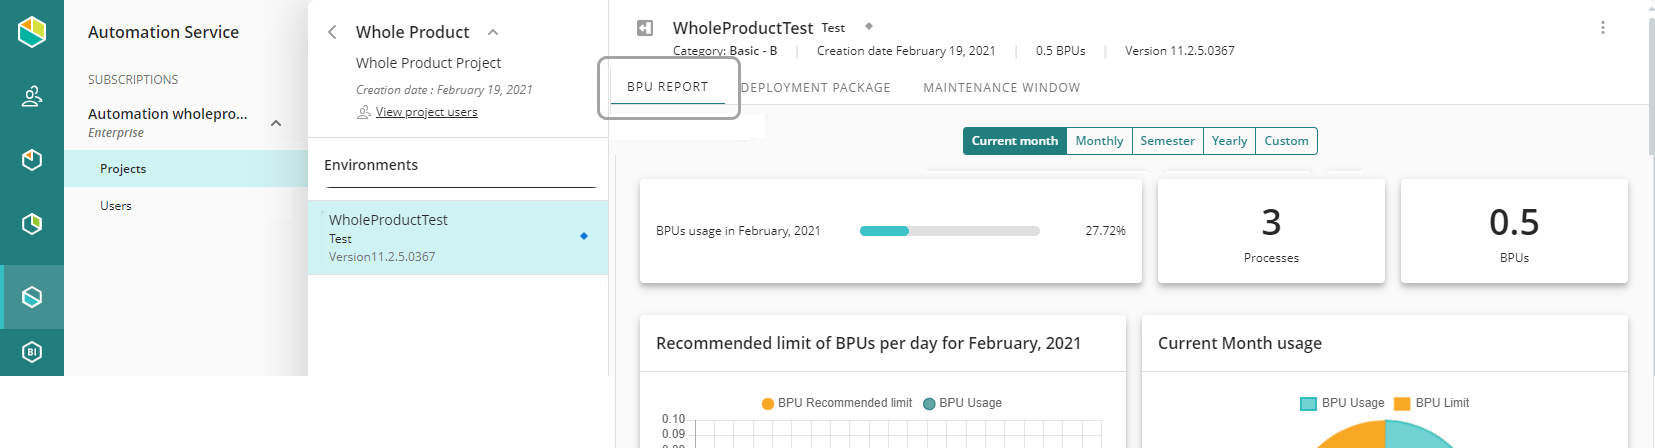
The report has five views that allow you to narrow down the information of your resource consumption:
•Current month
Shows the BPU consumption of the current month along with the number of BPUs consumed per process.
•Monthly view
The monthly view shows the BPU the evolution of the consumption per day or accumulated of the chosen month, along with the number of BPUs consumed per process. When loaded it displays by default the month prior to the current one.
•Semester view
The semester view shows the BPU consuption over the of the last six months, along with the number of BPUs consumed per process. If the date is changed, the report loads the consumption from the chosen month and the following six months.
•Yearly view
The yearly view shows the BPU consumption of the selected year along with the number of BPUs consumed per process. When no year is selected, the data displayed shows the data for the current year.
•Custom view
The custom view allows you to select an interval to generate the report, if the range selected is less than 30 days, the report presents the same options and graphics than the Summary view for the days selected. Otherwise, presents the same options and graphics than the Monthly view for the months selected.
For more information about the charts and options available in each view, refer to Detailed BPU Report.
Deployment package
The subscription owner or contributors of the Automation service can upload deployment packages. Once you select a project, open the Deployment package tab, and the click the Upload new package button:

Select the .BEX file:

Bizagi starts uploading the package, then it warns about a Maintenance window. This window is only triggered when you import the package. You can cancel the import or view the content of the package:

View content
When you click the View content button, Bizagi displays the content of all the elements of the catalog. The catalog is the container of the metadata of a Bizagi project:

You can select a category, to review the elements, or Expand all the elements. For example, you can review all the entities contained in the deployment package:

Import
When you click the import button the Customer Portal displays a warning, to make sure that the user confirms the import and activation of the maintenance window:

When you click Import package, Bizagi starts the deployment procedure. If an automatic maintenance window is opened, see Maintenance window, when a user tries to access the Work Portal, finds the following message:

When the deployment finishes, you can review the status of the package:

On the right-hand side of each package you can view the content of the package or download the BEX file. These are the same options you can find in the Management Console Web. For further information about deployment, see Deployment package.
Maintenance window
The subscription owner or the developer with access to the Customer portal can verify that the maintenance window is active by reviewing the Maintenance window tab of the project options:

Click the Start Maintenance button on the left-hand side to initiate the window.
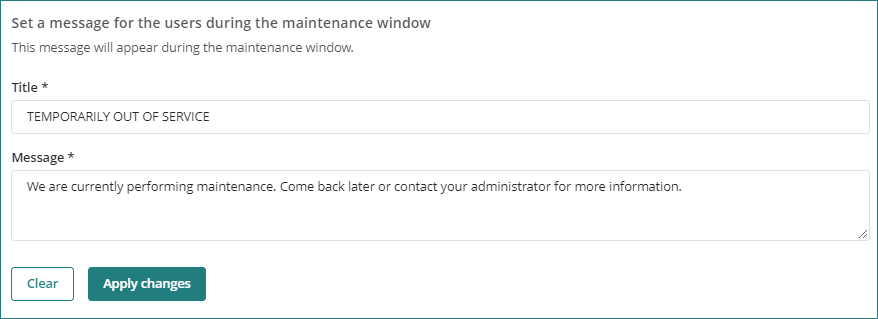
You can also define the time or the display message of the maintenance window. Open the Display message tab.

Here you can set the time where the Maintenance window is active.
You can also change the message displayed when users access the Work Portal under maintenance:
Click here for further information about the Maintenance Window.
Additional options for Environments
You can perform any of the following options in your environment by clicking the three-dot menu on the top-right corner of the environment options:

Option |
Description |
|---|---|
View Work Portal |
Opens the Work Portal of the environment in a new browser tab. |
View Management Console |
Opens the Management Console of the environment in a new browser tab. |
Full reset |
Performs a full restart of your environment. Full restart includes: •Restarting of the application. •Restarting of the Engine. •Restarting of the Scheduler. •Cleaning of the application temp files. •Cleaning of the forms cache. |
Partial reset |
Performs a partial restart of your environment. Partial restart performs the same operations than the Full reset but without cleaning of the forms cache. |
|
As Full restart service cleans the cache of the forms, your users may experience delays after they open a form, this occurs only once. |
