Overview
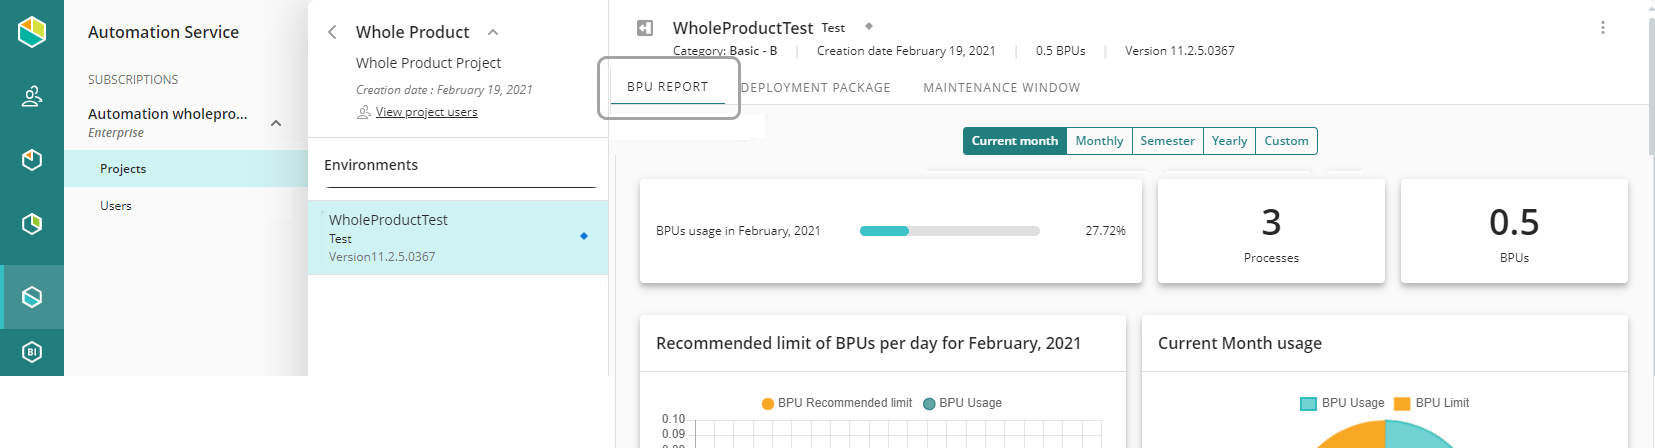
The BPU Report is useful to follow the resources consumption, and making decision about scaling up to the next Performance level by environment. Once you select a project in the Customer Portal, open the BPU report tab to see the report.
You can select the environment by following the path: Automation Service > Projects > Project > Environment
|
Data in the report is refreshed every 24 hours at 05:00 A.M UTC. |

The report has five views that allow you to narrow down the information of your resource consumption.
Current month view
This view shows the BPU consumption of the ongoing month and the number of remaining BPUs.
At the bottom of the screen the report shows all the processes involved and the number of BPUs consumed for each one.

In this view you see the following charts and tables:
Metric |
Description |
|---|---|
BPUs usage |
Shows the percentage of BPUs consumed regarding to the number of BPUs purchased in the current month. |
Processes |
Number of processes with opened or closed cases. |
BPUs |
Number of BPUs purchased in your environment |
BPU per day |
Shows the consumption per day of all the processes in the environment. This graphic shows data from the first day of the month to the date. |
Current Month usage |
Provides a comparison between the accumulated consumption of the current month versus the number of BPUs available. |
Processes table |
Number of BPUs consumed per process. |
Monthly view
The monthly view shows the BPU the evolution of the consumption per day or accumulated of the chosen month, along with the number of BPUs consumed per process on the bottom.
When loaded it displays by default the month prior to the current one.

In this view you see the following charts and tables:
Metric |
Description |
|---|---|
Show for |
Indicates the month selected from which you generate the report. If no date is selected, the report shows the information for the last month. |
Average BPUs usage |
Shows the average percentage of BPUs consumed regarding to the number of BPUs purchased. |
Processes |
Number of processes with opened or closed cases. |
BPUs |
Number of BPUs purchased in your environment |
Total BPU usage |
Show the total accumulated BPUs of all the processes in the environment. |
BPUs usage per day for |
This graphic appears when the report the selected in the Show for field is Per day. Shows the consumption per day of all the processes in the environment for the selected month.
|
Current Month usage |
Provides a comparison between the accumulated consumption of the current month versus the number of BPUs available. |
Processes table |
Number of BPUs consumed per process |

Semester view
The semester view shows the BPU consuption over the of the last six months, along with the number of BPUs consumed per process on the bottom. If the date is changed, the report loads the consumption from the chosen month and the following six months.

In this view you see the following options:
Metric |
Description |
|---|---|
Show for |
Indicates the month selected for the report. By default, the current month is selected |
BPUs usage |
Shows the percentage of BPUs consumed regarding to the number of BPUs purchased. |
Processes |
Number of processes with opened or closed cases during the selected month. |
BPUs |
Number of BPUs purchased in your environment. |
Current Month usage |
Provides a comparison between the accumulated consume of the current month versus the number of BPUs available. |
Processes table |
Number of BPUs consumed per process for the selected month. |
Yearly view
The yearly view shows the BPU consumption of the selected year along with the number of BPUs consumed per process. When no year is selected, the data displayed shows the data for the current year.

In this view you see the following charts and tables:
Metric |
Description |
|---|---|
Show for |
Indicates the year selected from which you generate the report . If no date is selected, the report shows the information for the current year. |
Average BPUs usage |
Shows the average percentage of BPUs consumed regarding to the number of BPUs purchased in the selected year. |
Processes |
Number of processes with open or closed cases. |
BPUs |
Number of BPUs purchased in your environment |
Total BPU usage |
Show the total accumulated reported in the last day of each month of all the processes in the environment. |
Current Month usage |
Provides a comparison between the accumulated consume of the current month versus the number of BPUs available. |
Processes table |
Number of BPUs consumed per process and year. |
Custom view
The custom view allows you to select an interval to generate the report, if the range selected is less than 30 days, the report presents the same options and graphics than the Summary view for the days selected. Otherwise, presents the same options and graphics than the Monthly view for the months selected.