Overview
The Bar chart Widget for Bizagi is available for download at Bizagi Widget Xchange.
Through this Widget, you will be able to display bar charts anywhere in your process forms to present statistics.

Before you start
In order to test and use this Widget, you will need:
1.Bizagi Studio previously installed.
2.This specific Widget previously installed, either as described at https://help.bizagi.com/platform/en/index.html?widget_xchange.htm, or as described at https://help.bizagi.com/platform/en/index.html?widgets_manualinst.htm.
Data model considerations
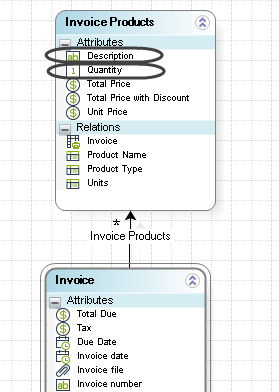
In order to use this Widget, you need in your data model a Collection type attribute which holds the multiple records to display.
Such collection should include these attributes:
•One integer type attribute, having the value of each record.
•One string type attribute, ideally a name that identifies each record in that collection uniquely.
The above means that ideally, logical records should not be repeated within the collection.
This type of chart is usually best to use to directly compare values of different categories.
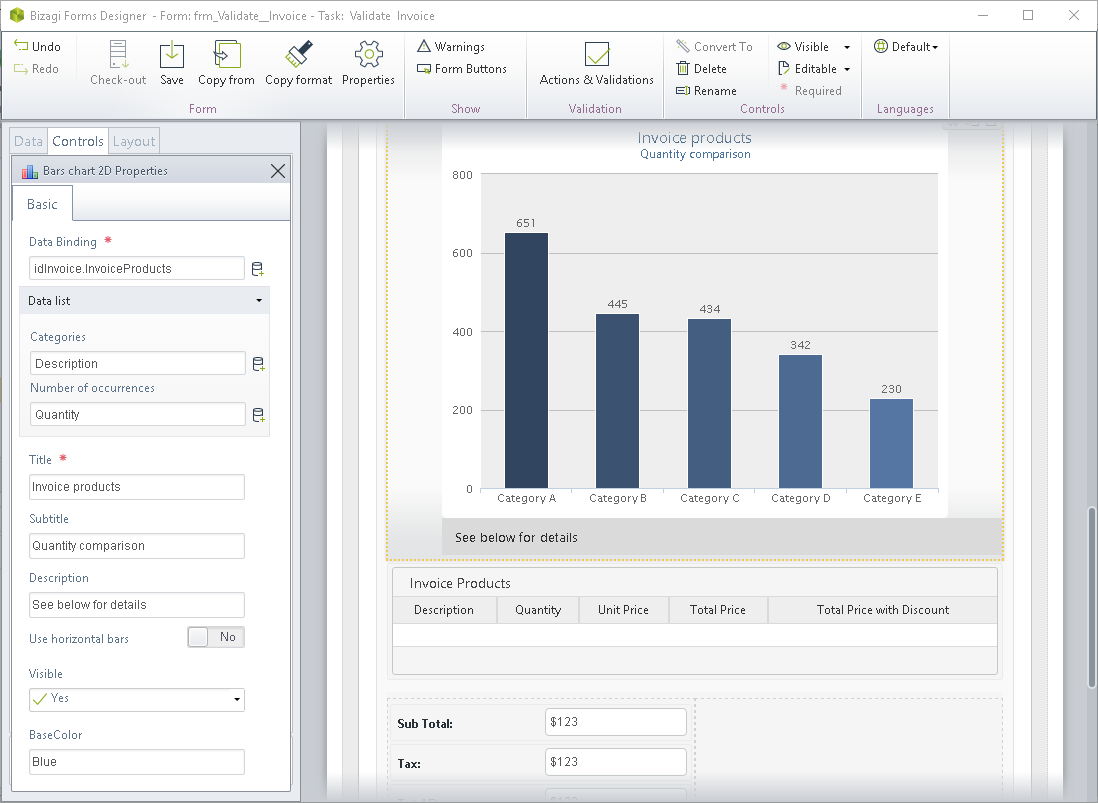
The sample image below shows the use of a Invoice products collection, while relying on the Quantity and Description attributes.

Properties configuration
In order to configure this Widget once it is installed in your project, include it in any form and set it properties in the Forms designer, just as you would do with any other type of Bizagi control.

Consider the following properties.
PROPERTY / SUB-PROPERTY |
POSSIBLE VALUES |
DEFAULT VALUE / SUGGESTED |
|---|---|---|
Data binding |
A collection type attribute which holds the multiple records displayed by the chart. |
Not applicable. This property is mandatory. |
Categories (sub-property of data binding) |
A name providing a way to identify uniquely each of the categories. |
Not applicable. This property is mandatory. |
Number of occurrences (sub-property of data binding) |
A numeric value having the amount registered per category. |
Not applicable. This property is mandatory. |
Title |
A descriptive information for the chart main header. |
(none) |
Subtitle |
A complementary bit of information for the header. |
(none) |
Description |
An optional caption for an elaborated clarification. |
(none) |
Use horizontal bars |
A setting to define if you wish to display the chart in a horizontal manner -bars (use Yes), or in a vertical manner -columns (use No).
|
Yes |
Base color |
The base color which is used for each of the records in the chart. Possibilities are: None (no base color means a colorful chart combining all), Green, Blue, Red or Brown. |
Default / none |
|
Notice all Bizagi controls and Widgets, enable a visible property which allows you to set if that control should be displayed in a given form or not (e.g, by using a business rule).
This Widget is designed as read-only. |
For complete documentation or more information about this Widget's possibilities (e.g, if you wish to customize and extend it), refer to the information about the implemented jQuery Plugin at http://www.highcharts.com/demo/column-rotated-labels.
Last Updated 10/28/2022 9:45:57 AM
