Overview
The Data Visualization option allows you to access and manage all Power BI connections configured for your Bizagi Apps reporting. In this menu you can edit your Power BI connections and reports, previously created from Bizagi Studio.
Keep in mind that if you update any field in the Power BI tab, there will be an impact on the Power BI connection and on the report. Thus, if a connection to the modified Power BI is being used in a Data Visualization control, it will be automatically updated.
You can modify report filters from Bizagi Studio exclusively. If you need to update them, you must do so directly in the report’s configuration in Bizagi Studio. After, you must perform a Deployment or a Microdeployment, of the Experience Matrix containing the report.

Before you start
Take into account that Bizagi's Management Console is used to manage Test and Production environments. Furthermore, Bizagi Studio must be used to configure new Power BI connections and reports.
Configuring connections
Once you have accessed the Power BI tab, a list with the current connections will be displayed. After selecting the one you want to configure, the connection name and its description are shown on the right side of the screen. Plus, the Client ID and Client Secret fields can be edited. Use the Apply button to save your changes.

Configuring reports
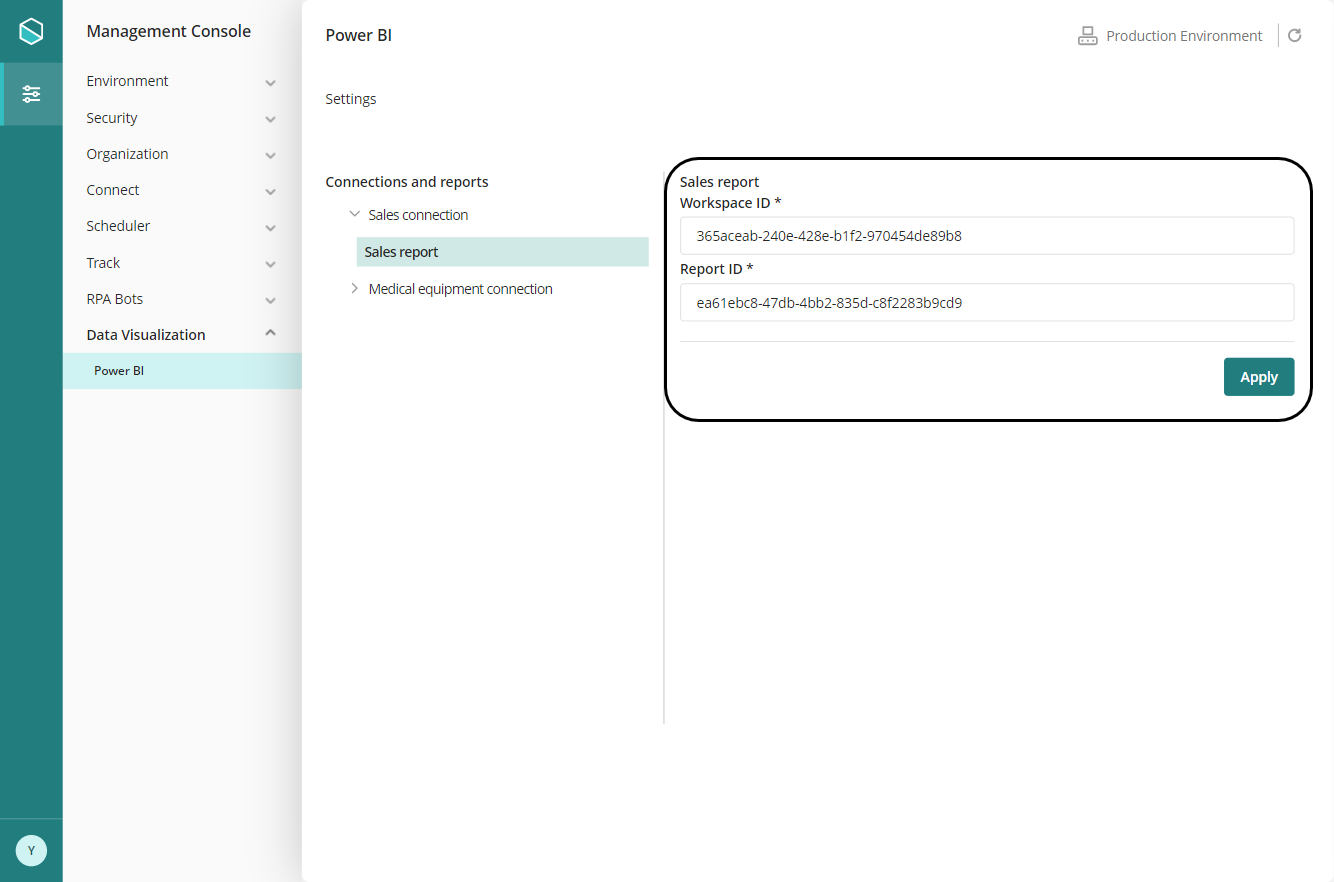
Once you have selected a Power BI connection, the reports will be displayed. After selecting the report you want to configure, the Workspace ID and Report ID fields can be edited. Use the Apply button to save your changes.

Last Updated 7/13/2023 11:53:57 PM