Overview
The Tools Tracing feature in the Management Console (MC) provides a tracking system for errors and interactions that occur during the execution of AI Agents involving External Connectors and SAP BTP Connectors. This functionality improves error visibility and enables detailed monitoring of AI Agent responses and executions, allowing you to efficiently query and filter trace information directly within the MC interface.
Usage Scenarios
•Real-time warning and error logging: Allows administrators to monitor Connectors execution status.
•AI task response monitoring: Captures and records details of responses generated by Connectors linked to AI Agents.
•Centralized logging: Traces are grouped and can be filtered in MC under the Tools category.
Configuration
To enable tracing, configure it from the MC by following these steps:
1.Navigate to: Tracking > Configuration.
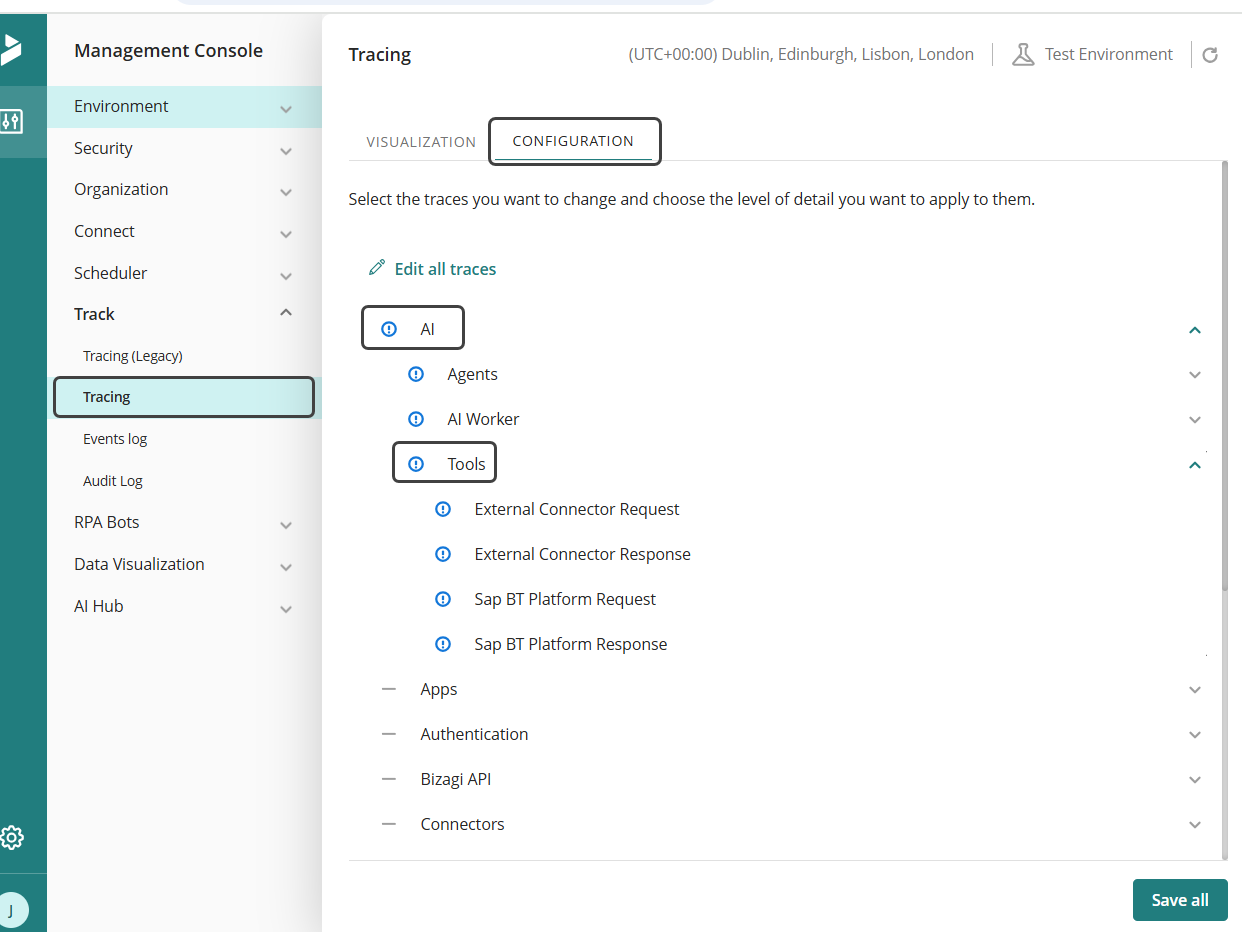
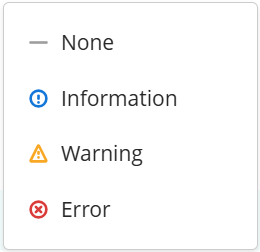
2.Select the logging level:
•Error: Logs only system errors related to Connectors execution.
•Warning: Logs only warnings generated during Connectors execution.
•Information: Captures Connectors responses in addition to errors and warnings.
Specific Configuration
•If only Error is enabled, only system errors will be recorded.
•If Warning is enabled, Connector warnings will also be included.
•If Information is enabled, Connector responses related to executions will also be logged.
•If the logging level is set to Error only, Connectors responses will not be saved.
This configuration allows adjusting the level of detail in tracing according to the project's needs.
Categories of logs
There are 2 main categories of logs for this Trace, each capturing different execution stages and Tools used:
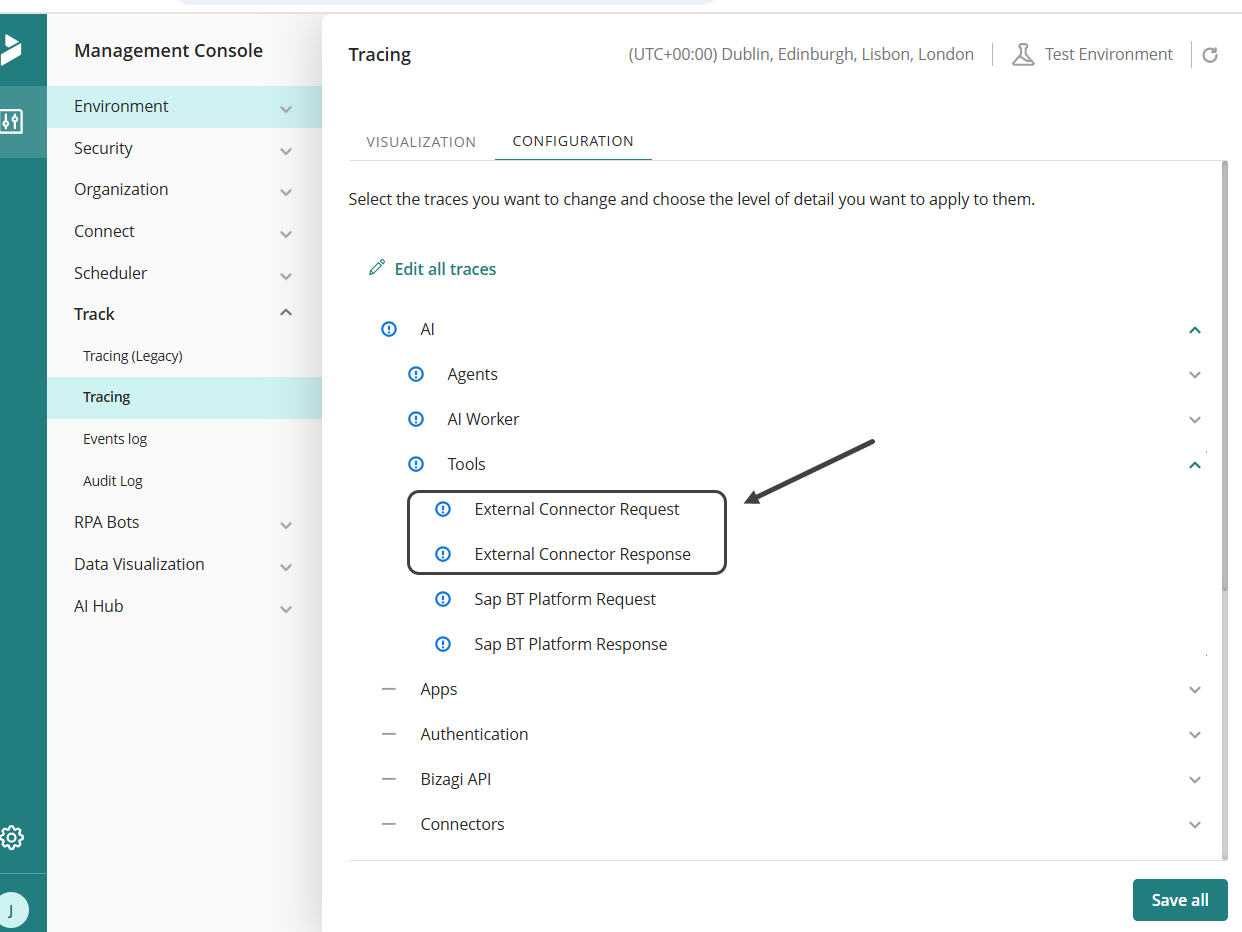
1. External Connector Execution
•External Connector Request: Captures the details of the request sent from Bizagi to the external service.
•External Connector Response: Records the response returned by the external service, including status and data received.
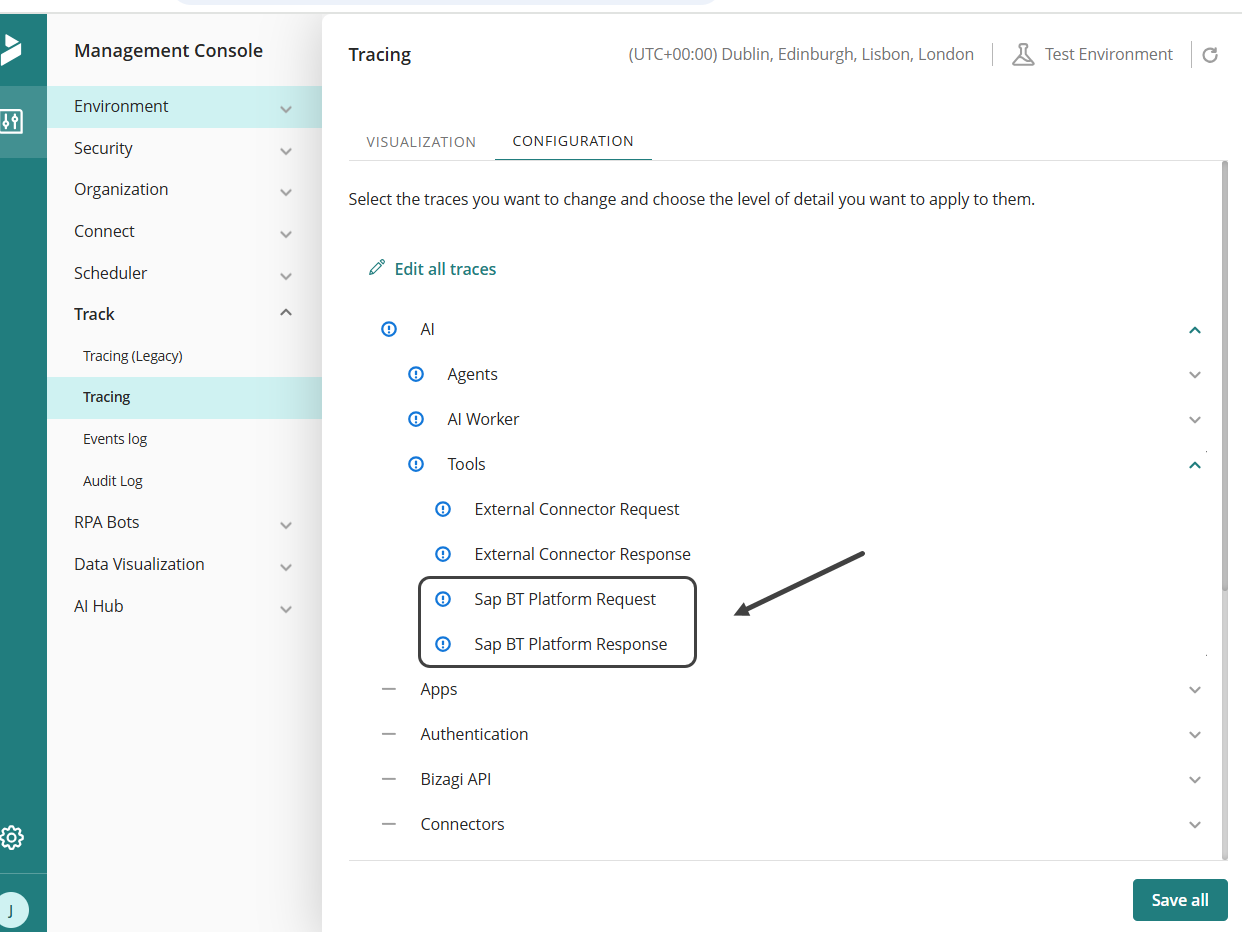
2. SAP BTP Connector Execution
•SAP BTP Request: Logs the request information sent from Bizagi to the SAP BTP service.
•SAP BTP Response: Captures the response received from SAP BTP, including execution results and potential errors.
Traces from Bizagi Studio
The prefix Studio_ identifies executions originating from Studio.
Example:
![]()
Studio_SAP Cloud_SAP BT Connector Action_AI_OUT_20250910.json
Traces from Workportal
A numeric prefix identifies the case number where the agent execution is running. If not present, the agent is being executed outside the context of a case.
Examples of mappings:
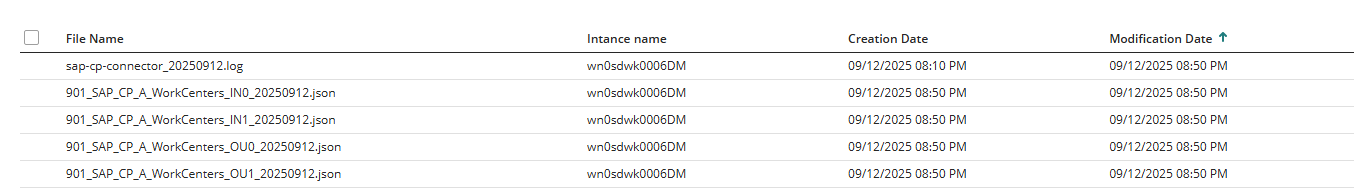
Inputs
901_SAP_CP_A_WorkCenters_IN0_20250912.json
901_SAP_CP_A_WorkCenters_IN1_20250912.json
Outputs
901_SAP_CP_A_WorkCenters_OU0_20250912.json
901_SAP_CP_A_WorkCenters_OU1_20250912.json
|
Note that to resolve any of these errors, you need to wait. If the issue persists, submit a ticket. |
Last Updated 11/19/2025 12:16:36 AM